



Basketball training imposes multiple demands on athletes, which can be classified as external load (EL), internal load (IL), and cognitive load (CL). Although coach behavior is known to influence athletes’ responses during training, its relationship with different load dimensions remains poorly understood. The aim of this study was to analyze coach behavior throughout the competitive microcycle and determining its influence on CL, EL and IL. A longitudinal observational descriptive study was conducted over 10 weeks with 12 professional female basketball players. A total of 25 training sessions were analyzed and categorized according to their position within the microcycle (MD-5 to MD-1). EL was assessed using Player Load and Average Player Load (Avg PL) via inertial devices. IL was quantified through TRIMP, RPE, and sRPE. CL was measured using cognitive RPE Cog and sRPE Cog. Coach behavior was coded using the Coaching Behaviour Assessment System (CBAS), grouping behaviors into three categories: SUPPORT, PUNISHMENT, and INSTRUCTION. Kruskal–Wallis tests, Spearman correlations, simple linear regressions, and Mann–Whitney U tests were applied. Significant differences were found between session types for RPE, sRPE, sRPE Cog, and Avg PL (p < 0.05), showing a progressive reduction as match day approached. SUPPORT and INSTRUCTION showed very large correlations with RPE Cog (r=−0.78 and r=+0.79, respectively; p < 0.001), explaining >60% of its variance. PUNISHMENT was significantly associated with both cognitive load and subjective internal load variables. No significant associations were found between coach behavior and objective EL or IL measures. Coach behavior was associated with cognitive load in professional basketball training, independently of task design or microcycle timing. Its monitoring and structured planning may contribute to a more precise and comprehensive management of training loads.
Basketball is an intermittent sport characterized by the constant alternation of high-intensity neuromuscular efforts, including accelerations, decelerations, changes of direction, and complex technical-tactical actions, which require the simultaneous integration of physical, physiological, and cognitive processes by the player.1 In this context, training load monitoring has become a fundamental tool for optimizing performance and reducing injury risk.2 The physical (external load, EL) and physiological (internal load, IL) demands of team sports have been widely studied; however, research on cognitive demands remains limited. Nevertheless, performance is determined by the nonlinear interaction of several distinct constructs, including physical, perceptual-cognitive, psychobiological, and social aspects.3 Recently, there has been growing interest in the cognitive load (CL) dimension in team sports.4 Players must process information, recognize tactical situations, and make decisions during sports practice, thereby accumulating associated mental fatigue.5 Specifically, in basketball, mental fatigue induced by sports practice may negatively affect key capacities underpinning performance, such as endurance, decision-making, shooting accuracy, and reaction time.6 Therefore, this imposed load must be managed to promote better adaptation in both cognitive and emotional aspects.7 To this end, Cárdenas and Conde-González8 describe that CL can be modulated by parameters such as the number of players involved, the available space, time pressure, or task specificity.
However, a key factor present in training that has received little attention in the scientific literature is coach behavior. The coach's communicative style, the frequency and type of instructions, the feedback provided, and the way tasks are structured can modify the cognitive demands perceived by players.9 In addition, positive leadership behavior on the part of the coach can contribute to the development of athletes' performance.10 Falces-Prieto et al.11 suggested that the presence of the head coach during a small-sided game task could have an influence on player intensity. However, despite its potential influence, there is currently limited empirical evidence on the direct relationship between coach behavior and the different load dimensions.
Understanding how coach behaviors modulate the loads experienced by players is particularly interesting in team sports, where microcycle planning must adequately manage the demands of both training and competition.12 Furthermore, an integrated approach would allow the coach's intervention to be adjusted to try to favor learning, adaptation, and recovery processes aligned with the objectives of each session. In this context, the present study aims to analyze basketball coach behavior and determine how it affects cognitive, external, and internal load variables during training. This knowledge could contribute to a more efficient load prescription, enabling the design of tasks for the management of mental load, both in its cognitive dimension, through manipulation of task entropy, and in its emotional dimension, through coach behavior.13
Materials and methodsStudy designA longitudinal descriptive observational study was conducted with a professional women's basketball team (Liga Femenina Endesa) to analyze the relationship between coach behavior and the three load dimensions: cognitive, internal, and external, recorded under real competition preparation conditions. For this purpose, this descriptive longitudinal study used the training session as the unit of analysis. The study was conducted in accordance with the principles of the Declaration of Helsinki and was approved by the Local Ethics Commission for Human Experimentation (protocol CEEAH-5745). Data collection was carried out over 10 weeks, during the second phase of the 2023–2024 competitive season.
ParticipantsTwelve professional basketball players (age, 25.92 ± 4.91 years; height, 178.83 ± 10.12 cm; weight, 74.08 ± 13.33 kg) participated in the study over the curse of 25 sessions. Inclusion criteria required athletes to be available for training without any ongoing rehabilitation process and to have participated in >90% of the scheduled sessions. Players who were injured or had repeated absences were excluded. All players met the inclusion criteria and completed all sessions. All players were informed of the risks and benefits of the study and provided written informed consent prior to participation. Players were permitted to withdraw their data, although none did so.
ProcedureThe analyzed data were obtained from the players' routine daily monitoring. The tasks performed were aligned with the specific technical-tactical objectives of each microcycle moment, allowing for the collection of players' real responses to stimuli characteristic of professional training. Training sessions were categorized as MD-5 (5 days before the match), MD-4 (4 days before the match), MD-3 (3 days before the match), MD-2 (2 days before the match), and MD-1 (1 day before the match), based on the distance between consecutive matches.14 MD+1 days (1 day after the match) were not included in this study, as these were rest days.
Each player wore a tracking device (Vector S7; Catapult Sports, Melbourne, Australia) in a dedicated vest, positioned on the upper back between the shoulder blades. These devices contain an accelerometer (±16 g, 100 Hz), magnetometer (±4900 μT; 100 Hz), gyroscope (>2000 deg/s, 100 Hz), heart rate monitor, and LPS. The technology used in this study has been validated for the measurement of distance,15 speed, accelerations, and decelerations,16,17 and Player Load.18 In addition, the device is linked to a heart rate sensor (Catapult Sports, Melbourne, Australia; 10 Hz), which has been validated for the measurement of TRIMP.19 Players always wore the same device throughout the study to avoid inter-device output variability. Using this device, the following objective external load variables were recorded: Player Load (PL) (arbitrary units [a.u]) and Average Player Load (PL avg) (a.u.). PL was calculated as the square root of the sum of the instantaneous rate of change in acceleration in the three movement planes (x-, y-, and z-axes) using the following formula20: PlayerLoad™ = [√(aᵧ₁ − aᵧ₋₁)² + √(aₓ₁ − aₓ₋₁)² + √(az₁ − az₋₁)²] / 100. This variable was selected because it is commonly used in basketball and is positively correlated with changes in direction.21 With the same device, the objective internal load variable was recorded: Banister’s training impulse (TRIMP) (a.u.). Banister’s TRIMP was calculated using the following formula:22 Banister’s TRIMP TL = [duration (min)] (HRex – HRrest) / (HRmax – HRrest) x 0.64e1.92x, where: HRex = average HR during exercise; HRrest = HR at rest; HRmax = maximal HR; e = 2.712; and x = (HRex – HRrest) / (HRmax – HRrest). During training sessions, the Coaching Behavior Assessment System (CBAS) was used: a systematic observation tool that allows for the objective recording and coding of coach behavior during training.23 The CBAS classifies behaviors into three broad dimensions: support, punishment, and instruction; and serves to evaluate the coach's communication style.24 Finally, each player’s declared rate of perceived exertion (RPE) (0–10 point scale), using the 0–10 point’s Borg’s rate of perceived exertion scale modified by Foster et al. 25 in order to collect subjective internal load. Furthermore, they also stated their rate of perceived cognitive exertion (RPE-Cog) (0–10 point scale), using the same 0–10 point’s scale,4 in relation to subjective cognitive load. Subsequently, specific in-court session RPE (sRPE) and RPE Cog (sRPE Cog) was calculatd by multiplying the specific session duration in minutes by the score registered in the scale and was presented in arbitrary units (a.u.) .4,25 sRPE has been proposed as a cost-effective alternative to heart rate-based methods as a global measure of training intensity that may more accurately quantify IL in intermittent sports.2,26 With the same goal in mind, the sRPE Cog has also been used.7 Data from rehabilitation sessions, strength sessions, individual sessions, warm-ups, and matches were excluded.
Activity editing was carried out during and after each session. The recording and editing of all activities were consistently performed by the same person. After data collection was completed, Catapult Sports OpenField cloud software (version 1.22.0) was used to extract each player's data per training session. Subsequently, following the predefined exclusion criteria, the collected data were exported to a Microsoft Excel spreadsheet (version 16.0, Microsoft Corporation, Redmond, WA) for further analysis. A three-week period was defined as a pilot phase for familiarization with the devices and questionnaires, as well as for establishing descriptive parameters for the tasks. Data collection did not affect the training dynamics in any case. Incomplete records were excluded from the sample.
Coach behaviorThe head coach's behavior was analyzed and coded using the Coaching Behavior Assessment System (CBAS)27 during all sessions. This systematic observation tool classifies coach behaviors as reactive or spontaneous, linked to reinforcement, technical correction, encouragement, or tactical organization of the team. This is carried out through direct observation and continuous recording of the coach’s behaviors, using specific codes for each behavioral category. In order to make the recording, the observer must be able to see the coach at all times during the training session, and the coach must not be told that he or she is being observed (consent for the observation has been obtained in advance). The recording is done in real time, as the behaviors occur. The observer writes down the code corresponding to each behavior as it occurs. At the end of the session, the behaviors recorded in each category are tallied, providing a measure of the frequency of the behaviors (number of times). Results are presented grouped into three behavioral categories derived from the factorial analysis of the CBAS, following the model of Sousa et al.:24 SUPPORT, which includes reinforcement and encouragement after mistakes; PUNISHMENT, which includes punitive behavior and punitive technical instruction; and INSTRUCTION, which includes general technical instruction and technical instruction after mistakes.
Statistical analysisThe unit of analysis was the training session (n = 25 sessions), using team mean values. Descriptive statistics are presented as mean ± standard deviation (SD). The normality of distributions was assessed using the Shapiro-Wilk test. Since several variables did not meet the normality criterion, non-parametric tests were applied consistently across all analyses. To evaluate differences in load variables across microcycle session types (MD), the Kruskal-Wallis test was used. The five microcycle types were treated as independent data: MD-5 (n = 4), MD-4 (n = 4), MD-3 (n = 5), MD-2 (n = 7), and MD-1 (n = 5). When a significant result was obtained, post hoc comparisons were performed using Dunn's test with Bonferroni correction. Effect size was calculated using eta-squared (η²). To analyze the relationship between coach behaviors and load variables, Spearman correlations were calculated. The magnitude of the correlation coefficient was interpreted according to Hopkins' scale:28 trivial (< 0.10), small (0.10–0.29), moderate (0.30–0.49), large (0.50–0.69), very large (0.70–0.89), and nearly perfect (> 0.90). Given the collinearity detected among CBAS variables, independent simple linear regression models were fitted for each behavior that showed a significant association with any load variable. The regression coefficient (β), adjusted coefficient of determination (R²adj), and p-value were reported. In addition, to complement the correlational analysis and examine whether differences in the variable of interest translated into differences between sessions with relatively low and high levels of that variable, CBAS categories were dichotomized using the median as the cut-off point, generating two groups per variable: low level (values ≤ median) and high level (values > median). The median was chosen as the cutoff point because it provides an objective division of the sample, avoiding the need to set arbitrary thresholds. Differences in load variables between both groups were analyzed using the Mann-Whitney U test. Effect size was calculated using Rosenthal's r (r = Z/√N), interpreted as small (r < 0.30), moderate (0.30–0.50), and large (> 0.50). Statistical analysis was performed using IBM SPSS Statistics v.25.0 (IBM Corp., Armonk, NY, USA) and JASP software version 0.17.2.1 Intel (Jasp Team, Amsterdam, Netherlands). The significance level was set at p < 0.05 for all analyses.
ResultsA total of 25 training sessions were recorded, distributed across five microcycle types: MD-5 (n = 4), MD-4 (n = 4), MD-3 (n = 5), MD-2 (n = 7), and MD-1 (n = 5).
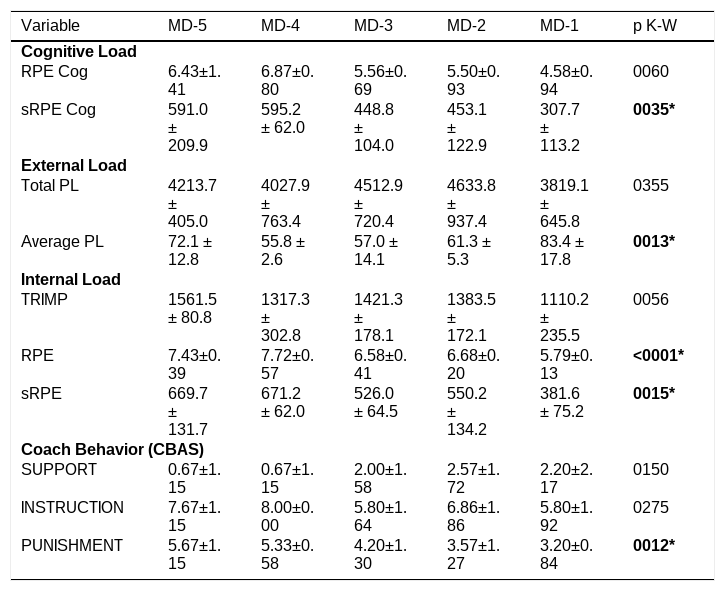
Load variables and coach behavior showed clear variations throughout the weekly microcycle, depending on proximity to match day (MD) (see Table 1). Regarding cognitive load, RPE Cog progressively decreased from MD-4 (6.87 ± 0.80) to its lowest value at MD-1 (4.58 ± 0.94). Similarly, sRPE Cog dropped from high values at MD-5 and MD-4 (591.00 ± 209.90 and 595.20 ± 62.00, respectively) to a marked decrease at MD-1 (307.70 ± 113.20), reflecting a reduction in cognitive demands toward the end of the microcycle.
Descriptive statistics (mean ± SD) of load variables and coach behavior according to microcycle session type. Results of the Kruskal-Wallis test are reported.
MD: match day; RPE Cog: rating of perceived cognitive exertion; sRPE Cog: RPE Cog × session duration; PL: Player Load; TRIMP: Training Impulse; RPE: rating of perceived exertion; sRPE: RPE × session duration; SUPPORT, INSTRUCTION, and PUNISHMENT values correspond to behavior frequencies recorded using the CBAS; p K-W: Kruskal-Wallis test p-value. *p < 0.05.
Regarding external load, Total Player Load remained relatively stable, with values ranging from 4027.90 ± 763.40 (MD-4) to a maximum of 4633.80 ± 937.40 at MD-2, followed by a decrease at MD-1 (3819.10 ± 645.80). In contrast, Average Player Load showed an increase toward the end of the microcycle, reaching its highest value at MD-1 (83.40 ± 17.80), compared to lower values at MD-4 (55.80 ± 2.60). Regarding internal load, both TRIMP and perceptual variables showed a downward trend. TRIMP decreased from 1561.50 ± 80.80 at MD-5 to 1110.20 ± 235.50 at MD-1. Likewise, RPE declined from 7.72 ± 0.57 at MD-4 to 5.79 ± 0.13 at MD-1, while sRPE decreased from 671.20 ± 62.00 to 381.60 ± 75.20 over the same period.
Finally, regarding coach behavior, support behaviors progressively increased from MD-5 (0.67 ± 1.15) to MD-2 (2.57 ± 1.72), remaining elevated at MD-1 (2.20 ± 2.17). In contrast, instruction behaviors decreased from high values at MD-4 (8.00 ± 0.00) to lower values at MD-3 and MD-1 (5.80 ± 1.64 and 5.80 ± 1.92, respectively). Similarly, punishment behaviors showed a downward trend, decreasing from 5.67 ± 1.15 at MD-5 to 3.20 ± 0.84 at MD-1.
The Kruskal-Wallis test revealed significant differences across session types for RPE (H = 17.99; p < 0.001; η² = 0.77), sRPE (H = 12.39; p = 0.01; η² = 0.46), sRPE Cog (H = 10.35; p = 0.03; η² = 0.35), and Average Player Load (H = 12.69; p = 0.01; η² = 0.48), with large effect sizes in all cases. No significant differences across sessions were found for RPE Cog (H = 9.04; p = 0.06), Total Player Load (H = 4.39; p = 0.35), or TRIMP (H = 9.22; p = 0.05). Post hoc comparisons using the Dunn-Bonferroni test indicated that RPE differences were located between MD-5 and MD-1 (z = +3.45; p = 0.006) and between MD-4 and MD-1 (z = +3.55; p = 0.004), with MD-1 showing the lowest values. Similarly, sRPE showed significant differences between MD-5 and MD-1 (z = +2.88; p = 0.04) and between MD-4 and MD-1 (z = +2.95; p = 0.03). For Average Player Load, differences were found between MD-3 and MD-1 (z = −2.84; p = 0.04), with higher values at MD-1.
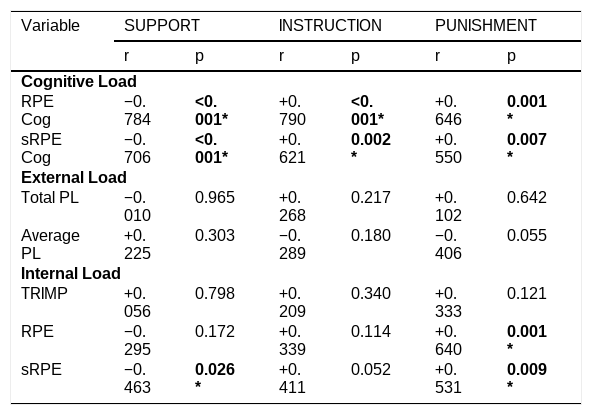
Spearman correlations (see Table 2) revealed significant associations between coach behaviors and load variables, particularly cognitive load variables, and to a lesser extent, internal load variables. SUPPORT showed very large negative correlations with RPE Cog (r = −0.78; p < 0.001) and sRPE Cog (r = −0.70; p < 0.001), and a moderate negative correlation with sRPE (r = −0.46; p = 0.02). INSTRUCTION showed very large positive correlations with RPE Cog (r = +0.79; p < 0.001) and large positive correlations with sRPE Cog (r = +0.62; p = 0.002). PUNISHMENT showed large positive correlations with RPE Cog (r = +0.65; p < 0.001), RPE (r = +0.64; p < 0.001), sRPE Cog (r = +0.55; p = 0.007), and sRPE (r = +0.531; p = 0.009). No significant associations were found between any of the three coach behaviors and Total Player Load, Average Player Load, or TRIMP.
Spearman correlations between coach behaviors (CBAS) and cognitive, external, and internal load variables.
r: Spearman correlation coefficient. Magnitude interpreted according to Hopkins' scale: trivial (< 0.10), small (0.10–0.29), moderate (0.30–0.49), large (0.50–0.69), very large (0.70–0.89). *p < 0.05.
Simple linear regressions described the relationship between coach behaviors and cognitive load. SUPPORT accounted for 61.5% of the variance in RPE Cog (r = 0.795; p < 0.001), 52.9% of the variance in sRPE Cog (r = 0.742; p < 0.001), and 25.4% of the variance in sRPE (r = 0.537; p = 0.008). INSTRUCTION accounted for 61.9% of the variance in RPE Cog (r = 0.798; p < 0.001) and 38.8% of sRPE Cog (r = 0.645; p < 0.001). PUNISHMENT accounted for 42.4% of the variance in RPE Cog (r = 0.671; p < 0.001), 38.2% of RPE (r = 0.640; p < 0.001), 30.8% of sRPE Cog (r = 0.583; p = 0.004), and 22.9% of sRPE (r = 0.514; p = 0.012).
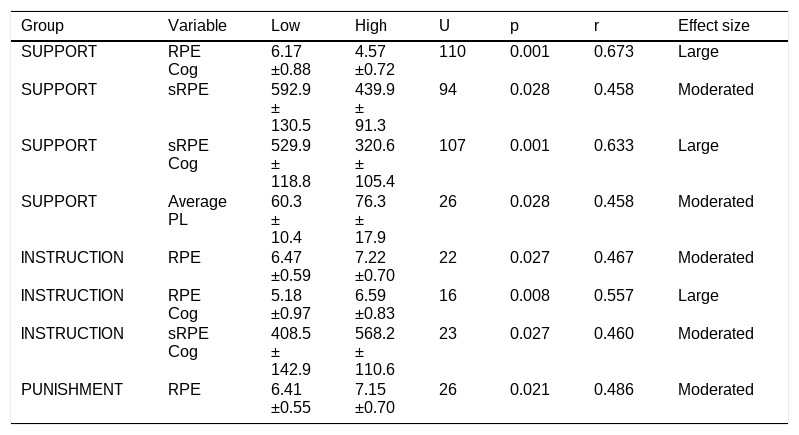
The comparative analysis between dichotomous groups using the Mann-Whitney U test (see Table 3) revealed that sessions with a low level of SUPPORT showed significantly higher values of RPE Cog (6.17 ± 0.88 vs. 4.57 ± 0.72; U = 110; p < 0.001; r = 0.673), sRPE Cog (529.90 ± 118.76 vs. 320.55 ± 105.43; U = 107; p < 0.001; r = 0.633), and sRPE (592.88 ± 130.51 vs. 439.88 ± 91.33; U = 94; p = 0.028; r = 0.458), with large effect sizes for cognitive variables and a moderate effect size for sRPE. Additionally, sessions with a low level of SUPPORT showed significantly lower values of Average Player Load (60.32 ± 10.35 vs. 76.28 ± 17.87; U = 26; p = 0.028; r = 0.458). Regarding INSTRUCTION, sessions with a high level showed significantly higher values of RPE Cog (6.59 ± 0.83 vs. 5.18 ± 0.97; U = 16; p = 0.008; r = 0.557), with a large effect size, as well as sRPE Cog (568.17 ± 110.64 vs. 408.48 ± 142.90; U = 23; p = 0.027; r = 0.460) and RPE (7.22 ± 0.70 vs. 6.47 ± 0.59; U = 22; p = 0.027; r = 0.467), with moderate effect sizes. Regarding PUNISHMENT, significant differences were only observed for RPE between high and low level sessions (7.15 ± 0.70 vs. 6.41 ± 0.55; U = 26; p = 0.021; r = 0.486), with a moderate effect size. No significant differences were found for the remaining cognitive, internal, or external load variables.
Comparison of load variables between dichotomous groups (low vs. high) of each coach behavior using the Mann-Whitney U test.
Values are expressed as mean ± SD. U: Mann-Whitney statistic. r: Rosenthal's r (Z/√N); small < 0.30, moderate 0.30–0.50, large > 0.50.
This study allowed for the observation of training load dynamics across their cognitive, external, and internal dimensions, as well as coach behavior throughout the microcycle, with the aim of monitoring athletes' performance level during each training session. The results showed significant differences in CL, EL, and IL variables across microcycle session types, with a progressive reduction toward match day. Significant differences were also found regarding coach behavior and session type, showing a decrease in PUNISHMENT behaviors as match day approached. Furthermore, coach behavior — particularly SUPPORT and INSTRUCTION — showed very large associations with CL, explaining >60% of its variance, while no behavior was significantly associated with EL or IL variables. These results suggest that the coach's behavior may be related to the cognitive dimension of workload, supporting the idea that cognitive load requires specific and proactive management aimed at optimizing the performance of basketball players during the competitive season.7,29
Significant differences were observed between microcycle session types and the various CL, EL, and IL variables, with the highest values recorded at MD-5 and MD-4 and the lowest at MD-1. This pattern is consistent with a training load reduction strategy as match day approaches, highlighting the importance of strategic load management to optimize performance and recovery.12,30,31 This progressive decrease in load, or tapering, is used as a tool to reduce accumulated fatigue, prioritizing performance maximization on match day.32 Other studies have described the same trend for CL,7 EL,33 and IL.34Nevertheless, it is worth noting that Average PL showed an atypical pattern compared to what has been observed in other studies,32,33,35 displaying higher values at MD-126. These results may be a consequence of the task structure, work density, the possible methodological variability among coaches or the competitive demands of a professional team, given that a progressive decrease in total PL was observed, while Average PL showed the opposite trend.
Regarding coach behavior throughout the microcycle, PUNISHMENT showed significant differences across session types, with a very large negative correlation with MD, indicating that punitive behaviors were more frequent in sessions further from the match (MD-5, MD-4) and progressively decreased as competition approached (MD-1). INSTRUCTION showed a similar decreasing trend, with slightly higher values at the beginning of the microcycle that diminished as match day drew closer. SUPPORT, in contrast, showed no systematic pattern throughout the microcycle, with variable values across sessions suggesting that this behavior responds more to context-specific factors within each session than to structured planning based on proximity to match day.
The relationship between coach behavior and load variables may offer applicable guidelines with a significant influence on training management. SUPPORT and INSTRUCTION behaviors showed very large associations with RPE Cog (r = −0.784 and r = +0.790, respectively; p < 0.001) and large associations with sRPE Cog (r = −0.706 and r = +0.621; p < 0.01), accounting for >60% of the variance in CL in the simple regression models. Our theoretical interpretation for these results may be that coach behavior during training modulates the cognitive load perceived by players, independently of task design or microcycle timing. These findings are consistent with those of Díaz-García et al. ,9 who demonstrated that active verbal stimulation from the coach significantly increased players' mental load. It has also been shown that training-related mental fatigue is significantly amplified when coach feedback focuses on errors or lacks empathy.29 Both behaviors (SUPPORT and INSTRUCTION) correlate with RPE Cog but in opposite directions: greater SUPPORT is associated with lower perceived cognitive effort, while greater INSTRUCTION is associated with higher perceived cognitive effort. This dynamic is framed within the theoretical model of cognitive load proposed by Cárdenas et al. ,8 according to which any additional informational stimulus increases the athlete's processing demands. The coach's verbal communication acts as an informational constraint that guides search and problem-solving processes, but may also overload the cognitive system when applied at high frequency.36 SUPPORT, in contrast, may act as an emotional regulator that reduces the perception of both cognitive demand and perceived effort.37 On the other hand, PUNISHMENT showed significant associations with both subjective internal load variables (RPE and sRPE) and CL variables (RPE Cog and sRPE Cog). A plausible interpretation for these results could be that punitive coach behaviors, in addition to affecting CL, also can modulate players' perception of physical effort, possibly through physiological activation mechanisms and evaluative pressure that elevate the athlete's stress response.38
To facilitate the interpretation and practical applicability of the results, coach behaviors were dichotomized to examine how different behavioral profiles were associated with load variables. Sessions with a low level of SUPPORT showed significantly higher values of RPE Cog (r = 0.673; p < 0.001), sRPE Cog (r = 0.633; p < 0.001), and sRPE (r = 0.458; p = 0.028), with large effect sizes for cognitive variables and a moderate effect size for subjective internal load, along with significantly lower values of Average Player Load (r = 0.458; p = 0.028). These results suggest that the absence of supportive behavior from the coach has a relevant cost on the load experienced by the athlete, which could lead to an increase in perceived CL and IL. McClean et al.39 emphasize that athletes highlight the need for coaches to maintain empathetic and supportive communication. A positive coach-athlete relationship improves cognitive functioning and reduces levels of acute stress responses and perceived exhaustion.10 Likewise, the absence of support would lead to a decrease in the relative intensity (EL) of the session, consistent with the findings of Halouani et al. ,40 who demonstrated that constant coach support can increase training intensity. On the other hand, sessions with a high level of INSTRUCTION showed significantly higher values of RPE Cog (r = 0.557; p = 0.008), sRPE Cog (r = 0.460; p = 0.027), and RPE (r = 0.467; p = 0.027), reinforcing the idea that an excessive frequency of technical instruction increases the perceived CL and IL of the session.36 The saturation of additional informational stimuli increases the athlete's processing demands and consequently their perceived fatigue.8 Finally, sessions with a high level of PUNISHMENT showed significantly higher RPE values than sessions with a low level (r = 0.486; p = 0.021). Sansone et al.29 report that athletes stated that their attention was diverted by coaches' criticism or refereeing decisions, limiting their ability to focus on the present moment. Behaviors centered on error recrimination or lacking empathy are associated with an increase in perceived fatigue.10 Compared to the correlational analysis, this more simplified approach detects a smaller number of significant associations, although the observed trends are consistent in direction and magnitude with the previous results. Therefore, these resultas are consistent with the idea that the coach’s behavior plays a moderating role in the different dimensions of training load in professional basketball.
This study has certain limitations. First, all incomplete records were excluded from the study due to missing values in at least one of the CL, EL, or IL measures. These missing values may have been caused by device recording errors or by players failing to complete the corresponding questionnaires. Another of the study's limitations is its limited statistical power, due to a relatively small sample size, which is inherent to the specific characteristics of the elite population studied. Furthermore, the microcycle structure was variable, changing according to the competitive schedule and resulting in an uneven number of recorded sessions. These situations are characteristic of professional competitive environments such as the one described here, due to fixture congestion, increased training sessions, and a higher frequency of travel.41 All of these factors contribute to a lack of control over contextual variables. It is important to note that, due to these specific characteristics of the competition, only a part of the season was recorded rather than the full season which limits the generalizability of the results obtained. These results are specific to and applicable to this particular group, but the methodology could be extrapolated to other groups or teams. To make the data easier to understand and apply in practice, we have analyzed it by team rather than by players. Additionally, coach behavior was recorded by a single observer using the CBAS system, which may introduce observation bias and limit inter-rater reliability. Future studies should consider including at least two observers with a reliability analysis to strengthen methodological rigor. Nevertheless, to the authors' knowledge, this is the first study to describe in detail the dynamics of coach behavior and its relationship with CL, EL, and IL during the competitive microcycle in professional sport.
ConclusionThe results of this study suggest that coach behavior was consistently associated with the cognitive load during professional women's basketball training, with an effect independent of task design or microcycle timing. Specifically, SUPPORT and INSTRUCTION behaviors accounted for >60% of the variance in perceived cognitive load, acting in opposite directions: SUPPORT was negatively associated with perceived cognitive effort, while INSTRUCTION was positively associated with it. PUNISHMENT, in turn, showed significant associations with both cognitive load variables and subjective internal load, demonstrating its capacity to increase perceived fatigue across both dimensions. A progressive reduction in load was also observed throughout the microcycle, with higher values at MD-5 and MD-4 sessions and a decrease toward MD-1. PUNISHMENT behavior followed a similar pattern, decreasing as competition approached.
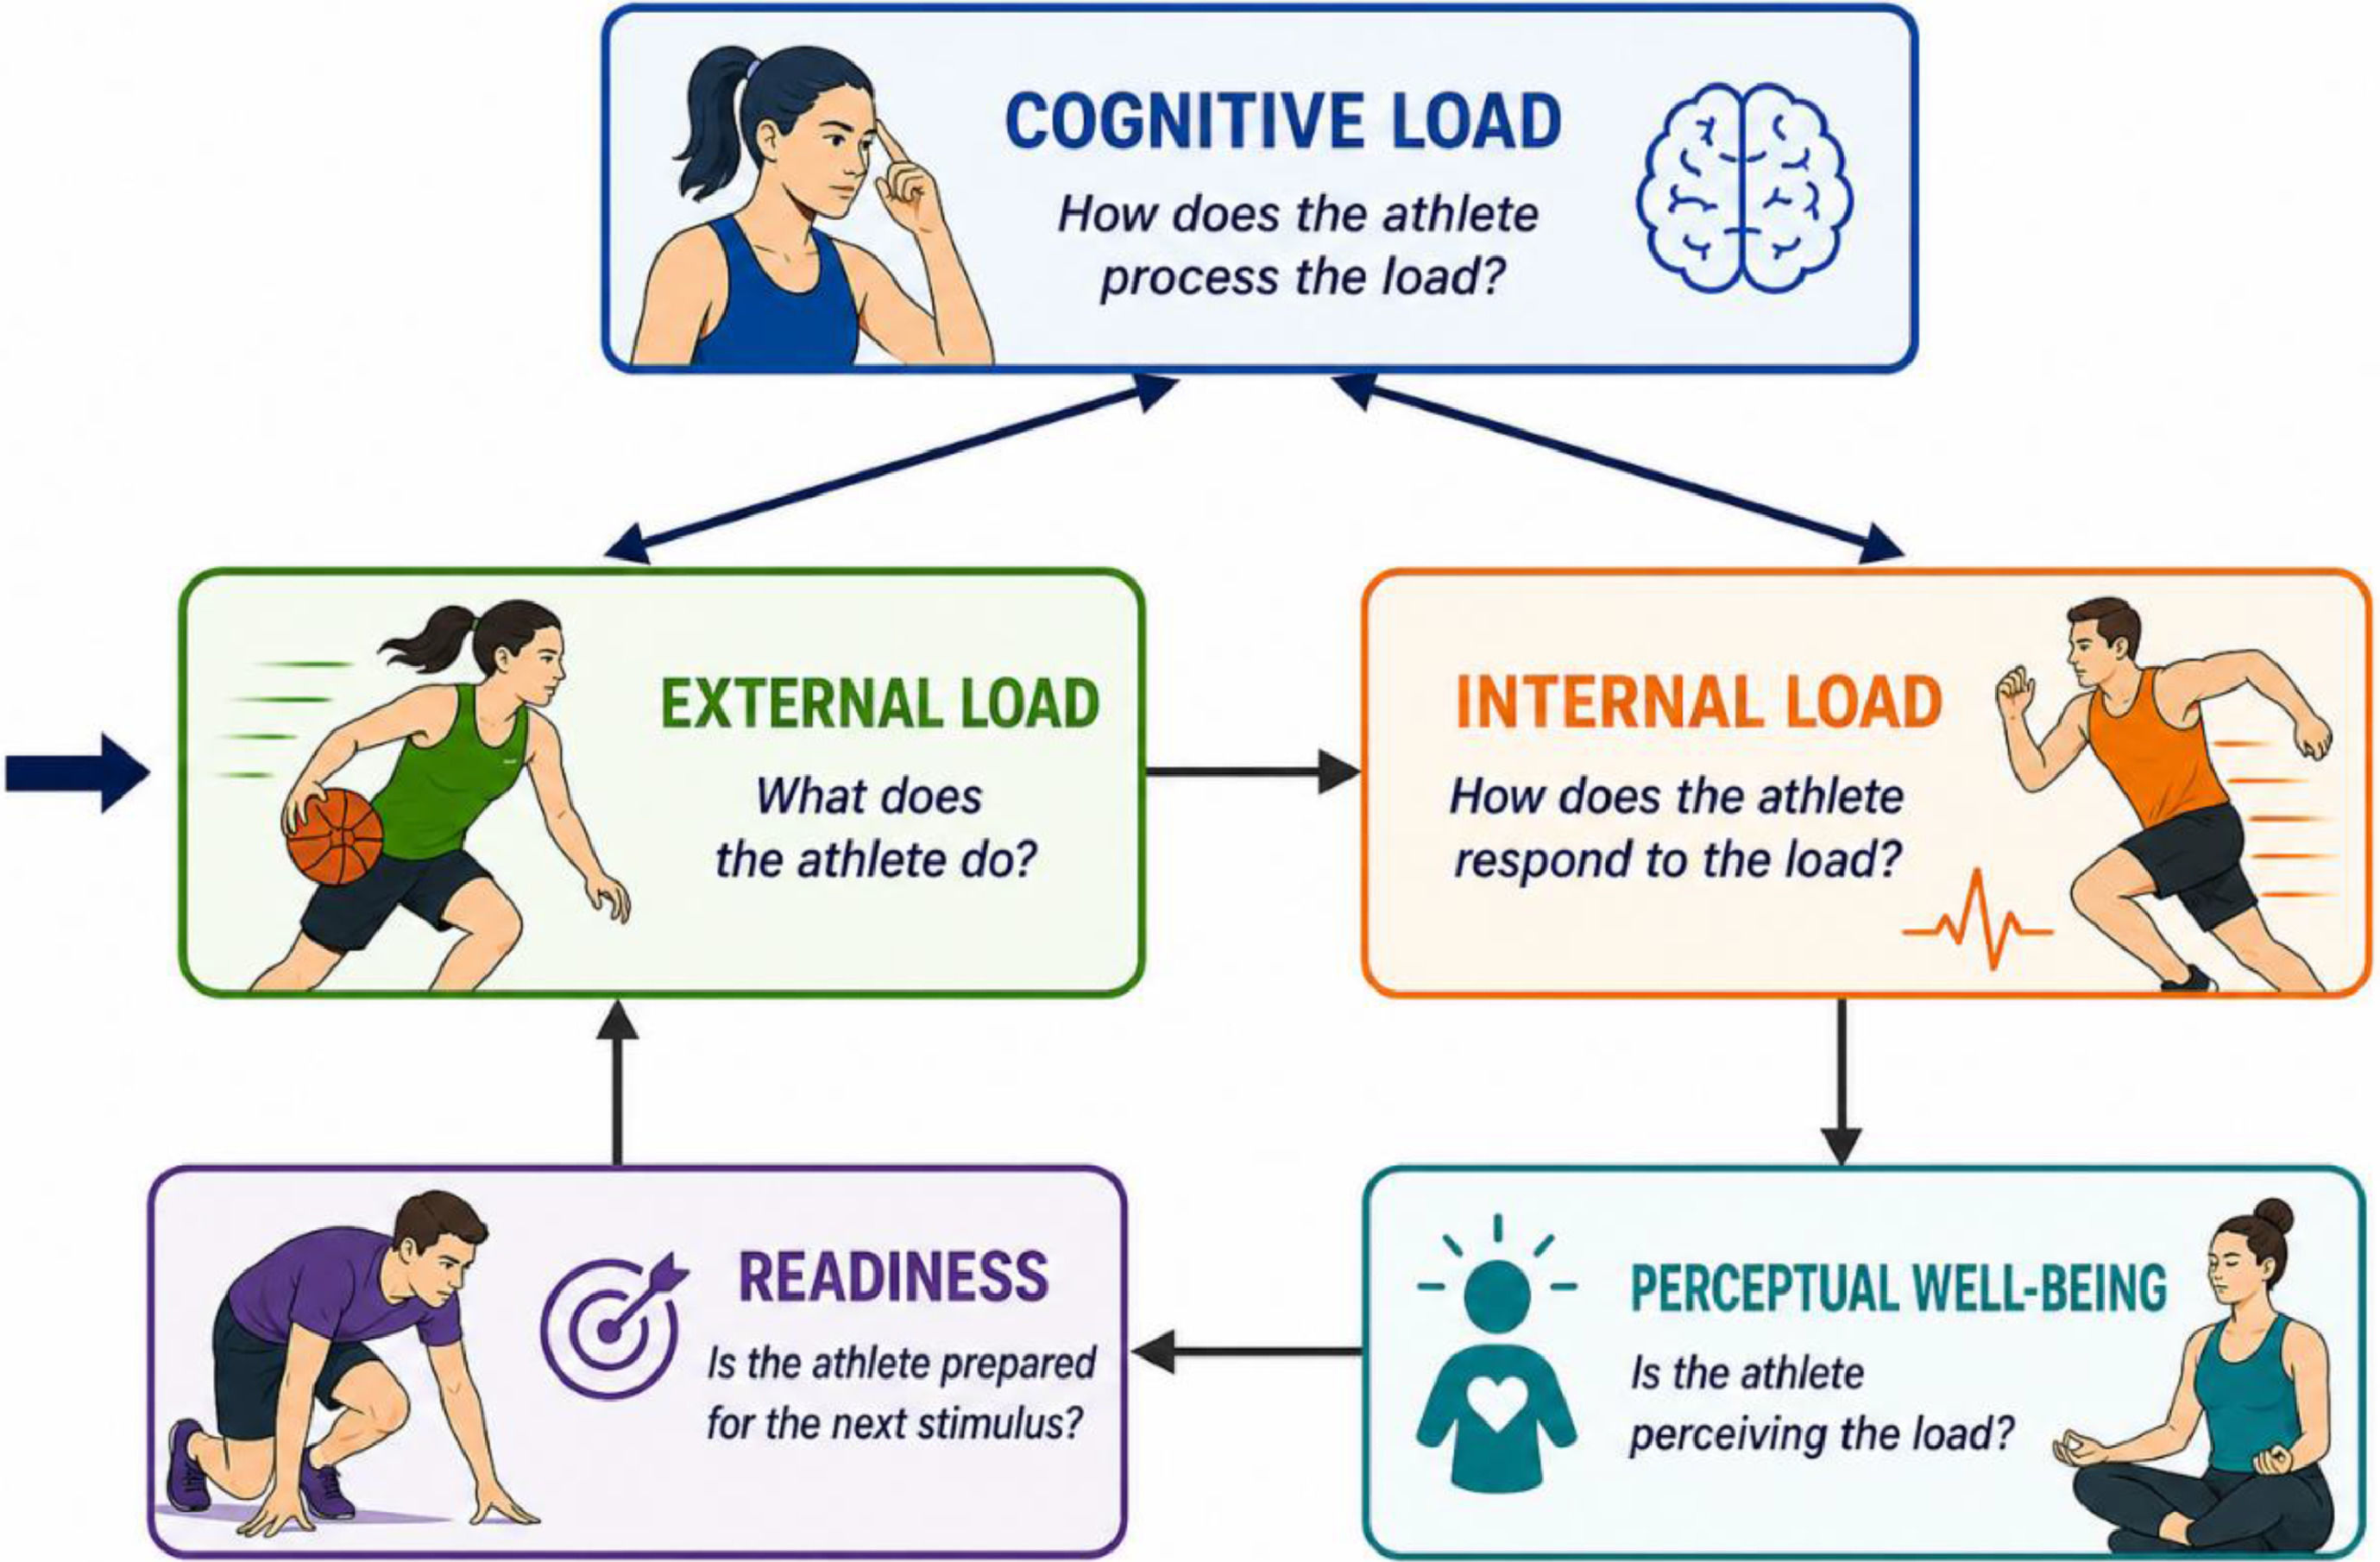
Practical applicationsThroughout this article, it has been emphasized that load (dose) and response data are more meaningful when evaluated as a combined dataset within the same context, given that the isolated assessment of cognitive, external, and internal demands may result in a reductionist view of load monitoring. In this regard, a small but significant adaptation to the athlete monitoring cycle described by Gabbett et al.42,43 is proposed, incorporating cognitive load as an additional and independent dimension that reflects how the player processes training stimuli, both in their cognitive and emotional aspects (see Fig. 1). This cognitive load would be placed in bidirectional interaction with the external and internal load dimensions already included in the original model, since the manipulation of any one of these constructs would produce changes in the others.4 This proposal is aligned with the integrative perspective of Cárdenas et al.8,37 Pol et al. ,3 and Fuster et al. 4,7 who highlight the need for integrative load monitoring to optimize athlete performance. Within the framework of this adapted model, coach behavior emerges as a specific modulator of this dimension, with the capacity to independently influence the athlete's perception of effort, in line with the approaches of Díaz-García et al.9 and Sansone et al. 29
Since this model represents a potential new starting point, it would be recommended to integrate the systematic measurement of cognitive load into routine load monitoring protocols, alongside tools that provide information on coach behavior. Adjusting the coach’s behavior based on how far away the game day is could be a possible tool for managing perceived cognitive fatigue.36 These findings would reinforce the need to incorporate content on effective communication and cognitive load management into coach education programs, recognizing the impact of the proposed tasks and coach behavior during those tasks on athletes' cognitive and emotional state.13,38
FundingThis work was supported by Grants PID2019–107473RB-C21, from the Spanish Government (MCIN/AEI/ 10.13,039/501,100,011,033/FEDER, UE), and 2021SGR-00,806, from the Catalan Government. The funders had no role in the study design, data collection and analysis, decision to publish, or preparation of the manuscript.
The Authors declare that they don't have any conflict of interests.
The authors would like to thank all the professional players, the club and the technical staff for their predisposition, involvement and participation in the study.