


The aim of this study was to determine associations between workload, myosin isoforms, and performance in professional basketball, by following the progress of a professional basketball team over four consecutive seasons. Thirty male professional basketball players (age, 27.6 ± 4.1 years;height, 200.1 ± 9.4 cm;weight, 98.5 ± 12.6 kg) from an elite professional basketball team participated in this retrospective observational study. To analyze muscle response and which types of fiber were most involved, fast and myosin in serum were evaluated from three blood samples taken during the season, using enzyme-linked immunosorbent assay (ELISA). Parameters recorded were: exposure time,. Slow and fast myosins for muscle responses. Competitions won, ranking, and mean points scored for performance. Average values per season analysed were 280.1 ± 58 h of exposure to practice,1440.58±533.46µlmol/L of fast and 1178.75±427.75 µmol/L of slow myosin. Performance, assessed as team ranking was 6879.5 ± 985.37 u.a. per season and 90.72±2.79 u.a. per game, winning 7 competitions. Large negative relationships could be observed between slow myosins and exposure time (rho=−0.63;p=.02); There were possible associations between slow myosins and player mean performance per game (R2=0.98;p<.01) and team performance outcomes achieved (R2=0.83;p = 01) during these four seasons. Higher slow serum myosin values could be related to higher exposure time, and lower slow serum myosin values could be associated with better player and team performance
Winning is the primary goal in professional sport, but training is often faced with conflicting imperatives: achieving optimal conditioning while minimizing injury and maximizing availability to play.1 In the context of this challenge, there is a need to keep an objective record of factors that potentially underpin both individual and team performance.2 To effectively measure the impact of training models on injury and illness incidence, data collection of both health- and performance-related variables must be integrated into all aspects of training and competition.3 At present, the goal of monitoring training response is to allow iterative adjustment of training plans to optimize team gains, prevent inappropriate overload,4 optimize recovery,5 minimize load-related risk factors, and reduce injury rates.6
Basketball is a strength-speed sport in which constant changes of direction and accelerations and decelerations predominate,7 and these actions take place intermittently during high-intensity periods.8 Players can achieve accelerations, but the risk factor could be related to their ability to decelerate at higher intensities, and to how their muscles can recover from those repeated efforts. In that context, therefore, we need to identify the role of decelerations as a risk factor (as eccentric muscle action)6 and to highlight the importance of strength workouts.9 For endurance, aerobic and anaerobic mechanisms are involved.10
This sport involves certain adaptations of the body, whose main purpose in a competitive setting is to repeat specific actions faster and more effectively. These adaptations are achieved by load management,11 and the control of the internal load induced by training and competition is a determining factor in the process of functional assessment of athletes and their performance.12 By knowing their specific behavior we will obtain tools for planning optimal workloads for each player and each team,13 according to the contemporary sports training model, which is governed not only by the concept of performance, but also by the availability of athletes, so one of its basic principles is precisely to avoid potentially damaging actions and loads.14 In this context, various biomarkers are proposed as indicators of muscle damage in the context of overload or overtraining.15
For the fast and slow muscle fibers actively involved in basketball training and competition,16 fast and slow myosin are used as markers of muscle damage and for studying the degree of such damage.17 Fast myosin (FM) is specific to fast muscle fibers only and slow myosin (SM) to slow and cardiac muscle fibers.15 Measurement of myosin isoforms was particularly valuable and sensitive for diagnosing grade I muscle injuries, which are usually difficult to diagnose with magnetic resonance and ultrasound, because mild injuries are mainly associated with fast-twitch fiber injuries.17 Diagnosing and controlling grade I injuries is a reliable tool with which to monitor workload18 and prevent grade I injuries progressing to grade II or higher in sports like soccer.19
Biomarkers and their possible associations with workload in team sports have been investigated. In professional soccer, hours of exposure, serum changes in FM and SM, creatine kinase and lactate dehydrogenase were analyzed during a season with the aim of identifying the type and amount of damage caused by training and competition workload.19 Myosin isoforms reached the maximum with the maximum load (1537 µl mol/L FM, 2195 µl mol/L SM) but decreased and adapted to the high level of demand (425 µl mol/L FM, 1342 µl mol/L SM), and their levels were maximal at the beginning of the season (1537 µl mol/L, 2195 µg/L). Another study20 examined the relationships between workload, injuries, and performance in professional basketball over seven seasons. The number of hours of exposure was related to the total number of injuries (r = 0.77; p = .04) and performance (total team ranking) (r = 0.77 and p = .04). However, the total number of injuries was related to performance (total team ranking) (r = 0.84; p = .02). But to the best of our knowledge, there has been little attempt to examine workload, myosin isoforms, and performance outcomes in basketball longitudinally.
This study aims to determine possible associations between workload, myosin isoforms, and performance outcomes in a professional basketball team over four seasons.
Materials and methodsStudy designAn study of a professional basketball team (FC Barcelona) was conducted over four seasons. The team played four main competitions every season: the Spanish Super Cup, the Spanish League (ACB), the King's Cup, and the Euroleague. The data were collected from 2010–11 to 2013–14. Players were examined at the beginning of each season using the FC Barcelona (FCB) periodic health examination protocol, consisting of a medical history and physical examination, anthropometry, spirometry, basal 12-lead ECG, submaximal cardiovascular exercise testing (with ECG and blood pressure monitoring), and echocardiography. The medical team was composed of one sports physician (GR) who was responsible for the health care of all players in the team on a day-to-day basis. Supplementary imaging studies or specific rehabilitation treatment required were provided by FCB Medical Services. The S&C coach (TC) recorded all strength, conditioning, and performance data. The data were recorded daily after every practice and game. All the participants had taken part in another retrospective study previously published.20
ParticipantsThirty male professional basketball players (age, 27.6 ± 4.1 years; height, 200.1 ± 9.4 cm; weight, 98.5 ± 12.6 kg) from the FC Barcelona professional basketball team participated in the study over four consecutive seasons. Each player was enrolled on the team for 1.7 ± 0.98 seasons during this period. Of the players involved, 23 were Caucasian and 7 were African American; 18 originated from Europe, 8 from North America, 1 from South America, 2 from Oceania and 1 from Africa. The inclusion criteria for all subjects required that each participant was part of the FC Barcelona professional team roster for at least a complete season, was aged over 18 years, was not involved in a time-loss injury rehabilitation process and had had all three blood tests. During the study, 14 of the 44 initial participants were unable to meet the inclusion criteria. All the players and the team were informed of the risks and benefits of the study and gave written informed consent to participate in it. Players were allowed to refuse the inclusion of their data. The study was conducted following the ethical principles for biomedical research with human beings established in the Declaration of Helsinki of the World Medical Association (amended in 2013). It was approved by the club's Board of Directors and by the Ethics Committee of the Catalan Sports Council, Spain (favorable reports are available upon request).
Season periodizationThe duration of each season was 42 ± 4 weeks. Workload planning, both conditional and technical/tactical, was designed with as similar a structure as possible between mesocycles, with a duration of 6 ± 1 weeks. Mesocycle periodization followed the block periodization model.21 According to the schedule of games and main competitions, the seasons were divided into 7 training periods (mesocycles), each made up of 6.16 ± 0.76 planning units (microcycles). They were distributed as follows: Monday was normally a day off or for individual recovery and technical drills; Tuesday morning: strength workout (1 h 15 min to 1 h 30 min) and technical drills (30 to 45 min); Tuesday afternoon: tactical practice (1 h 30 min to 2 h); Wednesday afternoon: tactical practice (1 h 30 min to 2 h); Thursday: technical drills and tactical walkthrough (1 h 15 min); Thursday night: game; Friday afternoon: recovery and metabolic workouts (1 h) plus half-court tactical practice (30 min); Saturday morning: tactical practice (1 h 30 min to 2 h).
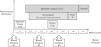
Each season was divided into seven mesocycles, always considering the competition schedule. The Spanish Super Cup was played during the first mesocycle. The second mesocycle focused on the start of the regular season of the Spanish League (ACB) and the Euroleague (European championship). Most of the first phase of the regular competitions took place during the third mesocycle. The fourth mesocycle included the King's Cup. The fifth mesocycle covered the second phase of the regular competitions and the Euroleague playoffs. The sixth mesocycle ended with the Euroleague Final Four, and the seventh mesocycle comprised the Spanish League (ACB) playoffs (see Fig. 1).
Workload
Team workload was expressed as the sum of the exposure time (EXP) of individual players to practice (EXPp) and competitions (EXPc). Exposure was measured as both number and hours (h) of games and number and hours of total practice sessions.22 It was counted from the start of the season until the first injury or the end of follow-up (end of season) for players who were not injured. Game time was defined as the number of hours that each player spent playing competitive games, and practice time refers to specific team practice on court, conditioning, and injury prevention workouts.
Blood sampling and processing: fast and slow myosinsBlood analyses were performed at the beginning of the preseason (first microcycle) and at the beginning of the third and fifth mesocycles. This periodization made it possible to obtain individual data before the main competitions that had to be played, so that there was time to adjust training loads if it was considered necessary.23 Two ml of blood was obtained, during the morning and in fasted state 48 h after the last training session. The procedure was standard venipuncture of the antecubital vein using a Vacutainer tube, centrifuging the sample at 2000 x g at 4 ºC for 10 min to obtain serum. The serum was stored at −80 ºC for later analysis.
Fast and slow muscle myosin assessment by enzyme-linked immunosorbent assay (ELISA)The sandwich ELISA was carried out as follows. Monoclonal anti-myosin fast and slow antibodies were coated onto a polystyrene plate. The calibration curve was generated with 6 different concentrations (from 0 to 250 ng) of purified pork myosin. Ten microliters of each serum sample was loaded in triplicate into the wells of the plate. The plates were incubated and stirred at 37 °C for 1 h and then washed 3 times with PBS wash and incubated at room temperature with 50 µl of TMB substrate for the luminescent reaction of the peroxidase. The reaction was stopped with 50 µl of 2 M H2SO4, and the plates’ absorbance was read at a wavelength of 450 nm.19
To analyze muscle response and determine which types of fibers were most involved during the season, we evaluated FM (G6 95% CI = 0.92–0.97; CV 95% CI = 0.76–0.81) and SM (G6 95% CI = 0.92–0.96; CV 95% CI = 0.53–0.83) in serum for the three blood samples18 according to the players’ individual workload and performance, or ranking (RKG), just two weeks before the sample was taken.19
MaterialsThe following materials were used: monoclonal anti-myosin fast antibody (Sigma M1570); monoclonal anti-myosin slow antibody (Sigma M8421); purified porcine myosin (Sigma M0273); polyclonal rabbit antibody (Sigma M7523); anti-anti rabbit antibody linked to peroxidase (Sigma A6154); SuperBlock blocking buffer (Thermo Scientific 37515); PBS Tween 20 (Sigma P7949); TMB peroxidase substrate (Sigma T0440); polystyrene plate (Corning 3591). Reagents: K2HPO4 (Merck 105,104), KH2PO4 (Merck 4873), NaCl (Merck 106404), H2SO4 (Merck 100731).
Performance outcomesThe team's performance outcomes were the number of competitions won out of the four played during the season: Spanish Super Cup, King's Cup, Spanish League and Euroleague. Team and individual performance is assessed by the official game statistics for both the team and the individual players: total ranking (RKG) by season and by game, and presented as arbitrary units (a.u). At the end of each game, for each player, the official RKG quantified PS, missed shots (MS: 2 points, 3 points and free throws), total rebounds (REB) (offensive plus defensive), assists (AST), steals (STL), turnovers (TOV), blocks received (BLKA), blocks made (BLK, personal fouls committed (PF), and personal fouls received (PFR). From these values a positive or negative ranking number is obtained based on the following formula: RKG = (PTS + REB + AST + STL + BLK + PFR) − (MS + TOV + BLKA + PF).20
Statistical methodsData are presented as mean ± standard deviation (SD). Initially, a central tendency descriptive study was performed. According to the size of the sample, intrasession reliability of measures was determined using Guttman's Lambda 6 test24 with 95% confidence intervals. The normality of each variable was determined by the Shapiro-Wilk test. With the average team values for the workload variable and the SM and FM serum-level variables for each blood sample, with regard to the normality of the variables, a one-way ANOVA was performed to determine their possible independence during the various seasons and samplings. When any significant main effects were found, pairwise t-test comparisons with a Tukey correction were used. Effect size (ES) (Cohen d) was calculated to determine the practical difference between baseline values and serum peaks. ES values of over 0.8, 0.8 to 0.5, 0.5 to 0.2, and lower than 0.2 were considered large, moderate, small, and trivial respectively. The results were weighted to take account of the number of players in each blood analysis. Subsequently, and with regard to the non-normality of the sample, a Spearman correlation coefficient was employed to evaluate the possible association between the individual values relative to the difference in the SM and FM percentage serum levels between the different blood samples and the workload variables. The coefficient values were between −1 and +1 in all cases. The correlation magnitude was defined according to Hopkins's criteria:25 random: 0–.09; low: 0.10–.29; moderate: 0.30–.49; large: 0.50–.69; very large: 0.70–.89; nearly perfect: 0.90–.99; perfect. Finally, multiple linear regressions were performed and the causal relationship between the average values per season and the SM and FM serum levels was explored. The statistical analysis was carried out using the JASP program version 0.11.1.0 for Windows 10 (JASP Team, Amsterdam, The Netherlands). The level of significance in all cases was p < .05.
ResultsWorkloadDuring the four seasons and up to the third blood analysis, the team played an average of 46 ± 7 games and had an EXP to practice of 280.17 ± 58.1 h during 156.1 ± 32.9 sessions per season. With regard to the results per season, the lowest workload values occurred during the first mesocycle (between 5.25 ± 0 and 10 ± 0 h EXP), except in the 2011–12 season (with 34.54 ± 6.34 h EXP), increasing in the third mesocycle (except in the 2011–12 and 2012–13 seasons), and decreasing, relative to the maximum values, in the fifth mesocycle (except in the 2012–13 season).
Fast and slow myosinsThe following average values per season were obtained: 1835.33 ± 848.97 µl mol/L for FM and 985.33 ± 896.19 µl mol/L for SM in 2010–11; 1369 ± 715.79 µl mol/L for FM and 1084.33 ± 208.56 µl mol/L for SM in 2011–12; 858.4 ± 279.15 µl mol/L for FM and 1700.25 ± 507.92 µl mol/L for SM in 2012–13, and 1786.66 ± 290.97 µl mol/L for FM and 1746±210.65 µl mol/L for SM in 2013–14.
Assessing the results according to when the analysis was performed, the period analysed showed average results for FM that were highest in the first mesocycle (1610 µl mol/L) and lowest in the fifth (1027 µl mol/L), and for SM they were highest in the first mesocycle (1395 µl mol/L) and lowest in the third (1222 µl mol/L) (see Table 1). By season, the highest levels of FM and SM were observed in all cases during the first mesocycle of each season, with the highest values in 2010–11 (2807.23 ± 972.22 and 2020.3 ± 835.57 µl mol/L respectively), and the lowest, also in both cases, in the 2011–12 season (545.99 ± 442.21 µl mol/L for FM and 1318.56 ± 308.71 µl mol/L for SM) (see Table 1).
Mean values ± SD of workload and fast and slow myosins by season and blood analysis during 4 seasons in a professional basketball team.

EXP: Exposure time; EXPp: exposure time to practice; EXPc: exposure time to competition, FM: Fast myonisn; SL:Slow myosin's; F/S: ratio fast myosin slow myosin serum; µl mol/L:nanoliter by mol; h: hours; a.u: arbitrary units.
Statistically, the one-way ANOVA test only showed significant differences between each of the blood analyses for FM and SM per season (F = 7.03; df = 3; p < .05). The post hoc analysis made it possible to observe differences between the 2010–11 season and the 2012–13 (p = .01; d = 2.18; Cohen's d = 3.3) and 2013–14 (p < .05; d = 1.71; Cohen's d = 2.57) seasons.
Spearman did enable us to assess the following possible relationships between workload and SM and FM concentrations. With regard to exposure, very strong negative relationships could be observed between SM and EXP (rho= −.63; p = .02) and EXPp (rho= −.63; p = .02), as well as between FM and EXPc (rho = −.69; p = .01).
Performance outcomesRegarding performance outcomes, during the period analysed team total season RKG was 6879.5 ± 985.37 a.u.; mean team RKG per game was 90.72 ± 2.79 a.u. . Team RKG per game was 88.19 ± 14.96a.u. for the 2010–11 season, 88.9 ± 18.19 a.u. for 2011–12, 92.75 ± 20.00 a.u. for 2012–13, and 93.84 ± 20.94 a.u. for 2013–14. By player and game, RKG values were 9.4 ± 2.51 a.u. for 2010–11, 8.4 ± 2.33 a.u. for 2011–12, 7.53 ± 0.68 a.u. for 2012–13, and 7.1 ± 2.42 a.u. for 2013–14. The team won 7 competitions (3 Spanish Championships, 2 King's Cups, 2 Spanish Super Cups) and achieved a European top four qualification (Final Four) on 3 occasions: 2010–11 (King's Cup, Spanish Championship and Spanish Super Cup), 2011–12 (Final Four, Spanish Championship and Spanish Super Cup), 2012–13 (Final Four, King's Cup) and 2013–14 (Final Four, Spanish Championship).
A multiple regression analysis showed possible associations between SM, as an independent variable, and performance outcomes: player mean RKG per game and season (R = 0.99; R2 = 0.98; adjusted R2 = 0.97; p < .01) and the team performance outcomes achieved (R = 0.91; R2 = 0.83; adjusted R2 = 0.75; p = .01) during these four seasons.
DiscussionThe main results obtained in this study showed possible relationships between high exposure time and higher SL serum values. Lower myosin values could also be associated with better player and team performance.
The study allowed to assess how the application of different exposures to workload has an influence of both FM and SM fibers as indicators of muscle damage in the context of professional basketball. However, the differences found between these seasons (p < .05) require each season to be assessed independently.4 As a consequence of workload, the sarcomere is affected, and the FM and SM contraction proteins are disrupted and enter the bloodstream. The discharge of the two types of myosin into the blood will give an idea of the individual variations in muscle injuries that occur during this period of time.17 This may be reflected in the differences between the FM and SM found in the 2010–11 season and those found in the 2012–13 and 2013–14 seasons (p < .05). In the latter two, the Euroleague schedule was extended, entailing an increased training and competition load and a reduction in recovery.26 Higher chronic volume of workload,2 lower damage occurs to the fibers with less increase in both types of myosin in the blood, especially FM. However, although the magnitude of the relationships could be stronger and more conclusive (which could be justified in view of the complexity and multitude psychological2,10 and physiological4,18 factors involved in a sport like basketball), but could also be related to the significant negative trends observed between SM and FM with EXP (p < .01– 0.05). The higher the workload, the lower the concentration of FM and SM.27
During the three phases of training and competition we studied, the discharge of myosins into the bloodstream decreased, and was significant only for FM, which should be interpreted as an adaptation to the persistent load increases7 and to chronic workloads over the course of the season.11,19 Training, properly planned, can offer a protective effect for improvement in recovery and programming differences.28 The period of adaptation (which in the sporting field usually corresponds to the preseason) leads to stabilization of SM serum concentration. Adapting preseason training designs7,29 without workload spikes11 or overloading players and enabling them to recover as quickly as possible,30 but doing so in a specific way31 oriented to the type of muscles and metabolic pathways involved, could be much more efficient.11 The evolution of molecular parameters during the period studied followed this approach. If we assess the differences between the values for the different blood samples, we could reinforce this argument, since negative trends are observed between SM and FM concentration and total workload between the first and second blood samples (p < .05), but not the third.
Adapting to workload normalizes FM and SM values.18 While the programming of workload is managed precisely with the intention of reducing the muscle damage that is supposed to be more affected by one type of contraction than another,15 it is observed that eccentric work is the factor that protects against the appearance of SM,32 so programming should be specifically oriented to workload progression, to achieving optimal chronic values in terms of volume and intensity,11 rather than being focused on the type of contraction.
In a professional setting it will always be conditioned by results.20 The seasons with the best sporting results (2010–11 and 2011–12, with 3 successful outcomes each) are those in which there were greater significant differences compared to the others. On the one hand, these were the seasons with the shortest exposure time in training, but with a higher number of matches. According to these results, the lowest serum SM levels are related to the best team achievements in the four seasons. The fact is that lower SM values are related to better player performance (R2 = 0.98) and team season outcomes (R2 = 0.84). The load of training and match activities could be identified by molecular serum values. Its variations would therefore be associated with the muscular response to this load, which would allow us to prepare the teams by stabilizing the optimal values during the course of the season. In this context, it could be asked whether despite the fact that the study found values greater than 3000 µl mol/L, it could even offer guidelines that entail less muscle damage, understanding that players adapted to the specific competitive load. To propose a more progressive and less aggressive preseason looks like the best option. With regard to the results shown, the optimal periodization would aim to avoid damage to slow fibers, using aerobic work but avoiding overload to protect players from injuries. However, controlled eccentric exercise needs to be maintained, avoiding FM injuries and achieving competitive efficiency. Load management could protect against both types of fiber damage.
This study has some limitations. On the one hand, the competitive context of the sample and the ecological proposal limited the sampling to only three times per season. On the other hand, the factors involved in basketball training and competition are multifactorial.33 Samples were always taken after the same rest period and the participating players were followed during the entire training period, match and pre-blood samplig loads, but different individual factors may influence the results. Therefore, the results should be interpreted globally and specific to the working group and should be contextualized according to the different molecular variables that may be associated with the types of training and working hours, as well as with the conditions of each season and lifestyles.Finally, the follow up is carried in the usual conditions of a designed training program. For that reason, the amount of myosin in blood was always very low, and had to be considered normal for their usual sporting activity. It does not correspond to incapacitating injuries of a kind that would keep them out of the game. The increase of both types of myosin in blood can only be considered a grade 1 injury.19 However, these results have the value of having been recorded in elite players over 4 consecutive seasons.
ConclusionIn conclusion, for this specific context, higher exposure time could be related to higher slow serum myosin values, and there are possible associations between lower SM values and better performance outcomes.