


Enhancing the anaerobic capacity of female basketball players is vital for improving competitiveness and performance. Power bicycle training, a high-intensity anaerobic exercise, improves lower-limb muscle strength and explosive power. Power bicycle training involves progressive increases in load in high-intensity intervals, making it an effective training method for athletes.
ObjectiveTo determine the effectiveness of power bicycle training for enhancing anaerobic capacity and evaluate its correlation with cost-effective measurement metrics.
MethodsOverall, 47 female athletes from Hainan Province who participated in the National University Basketball League were divided into the control group (n = 23) and the training group (n = 24). The training group underwent a 4-week, 7-session power cycling program, twice per week, with four power cycling sessions. Body composition and lower-limb morphology were measured quarterly. Data analysis was performed using SPSS 22.0 software.
ResultsNo significant differences in power cycling metrics were observed between the groups before training (p > 0.05). After training, significant differences were observed between the groups (p < 0.05). Key power cycling metrics, including average power, average power/body weight ratio, minimum power, and total power, were significantly influenced by the number of training sessions (p < 0.05). Notably, power increased after sessions 5 and 6 compared with after sessions 1 and 3 (p < 0.05). Strong positive correlations were observed between anaerobic power cycling and lower-limb muscle mass and circumference. Multiple linear regression models for power cycling metrics were developed.
ConclusionsThe method proposed in this study is effective for developing training models, especially when physical assessments or experimental tools are unavailable. It represents a time-saving, cost-effective approach for practical training guidance.
Basketball is a dynamic and intermittent invasion team sport characterized by fast and short displacements.1 According to the new basketball rules introduced in May 2000, the attack time has been shortened from 30 s to 24 s, whereas the backcourt time has been shortened from 10 s to 8 s. Additionally, the game is divided into four periods, with each period being 10 min long. Therefore, the corresponding tactical requirements and energy supply requirements of the players have also changed, increasing the speed of the game’s rhythm. Studies on the anaerobic energy supply capacity of basketball players have reported that high-intensity exercise accounts for 16.1 % of the total playing time.2,3 Furthermore, the anaerobic exercise ability,3,4,5 biomechanics,6 physiological index,5,7 and competitive technology have been reported as crucial factors influencing players’ basketball performance.7 Thus, exploring effective training methods to improve the anaerobic ability of basketball players is vital for improving performance.
Basketball involves numerous short-duration, high-intensity repetitive movements, including continuous jumping, quick sprinting, accelerations, abrupt stops, and various dynamic positional changes.3,4 It involves rapid movements to maintain or gain positions on the court. High-intensity or maximal-intensity short-duration movements and quick sprints are vital for scoring. Both anaerobic and aerobic energy systems are activated to meet the energy demands of the muscles under different exercise intensities, considering the nature and characteristics of basketball.5,6 Extensive jumping and high-intensity running, which are accompanied by relatively high average blood lactate concentrations, are frequently performed by basketball players. During the game, elite basketball players maintain a heart rate that is 85 % of their maximum heart rate or higher. Consequently, most researchers believe that basketball mainly depends on anaerobic metabolism.6 To improve the performance of basketball players, effective training methods are needed to improve their anaerobic capacity.7
The anaerobic exercise ability of basketball players can be effectively evaluated using tests such as the 20-meter, 30-meter, and 35-meter repeated sprint tests; suicide run test; Bosco test; and anaerobic power bicycle test.8,9,10,11 Numerous sports studies have reported that the 30-s anaerobic power bicycle test is an effective and accurate evaluation method. Training methods, such as circulatory resistance training in a hypoxic environment,12 high-intensity interval training (HIIT),13 and Swiss ball core strength training, can improve the anaerobic exercise ability of athletes.14 However, the actual effect of these training methods is not optimal, and they do not completely simulate the intermittent high-intensity exercise mode of basketball players in the competition.
One of the most commonly used methods to assess muscle mass growth in many sports is the measurement and study of limb volume.15,16 The effectiveness of strength training programs can be evaluated by measuring limb circumference and volume.17 Limb muscle content, circumference, volume, and muscle strength are altered by various training programs, as demonstrated previously.17 For instance, some studies have demonstrated that low-load blood flow restriction training and regular high mechanical load resistance training increase the total cross-sectional area, volume, and strength of the quadriceps and thigh muscles.18,19 Muscle strength closely correlates with cross-sectional area; thus, limb circumference measurements are frequently used as an alternative indicator of strength growth, both in healthy populations and in patients.20,21 Exercise alters lower-limb strength and thigh circumference, and several studies have demonstrated a positive correlation between thigh circumference and lower-limb muscle strength.22,23,24 Consequently, when evaluating the effectiveness of training methods or making objective comparisons between the efficiency of two training methods after prolonged exercise, it becomes necessary to assess muscle mass changes from subtle alterations. In this case, visual observation alone is insufficient; thus, changes in limb volume or circumference measurements must be objectively evaluated.24,25,26 Consequently, the strength growth of female basketball players can be evaluated by measuring changes in lower-limb circumference.
Power cycling test indicators, such as mean power, peak power, fatigue index, peak power/body weight, mean power/body weight, and total work, are closely associated with body composition parameters, including muscle mass percentage, fat mass percentage, and fat-free mass, in experienced female basketball players. Research has shown that higher muscle mass percentage and fat-free mass are significantly positively correlated with greater peak power, mean power, and jump performance, while a higher fat mass percentage is negatively correlated with these performance metrics and is associated with an increased fatigue index, thereby reducing endurance capacity.27,28 Furthermore, relative power metrics, such as peak power/body weight and mean power/body weight, provide a more accurate reflection of explosive strength and relative performance capacity, and they serve as key variables for distinguishing athletes at different competitive levels.28,29 Total work and mean power on power cycling tests can also be accurately predicted using body composition parameters, highlighting the statistically significant relationships between these metrics.⁶ In terms of the training methodology, velocity-based resistance training has been shown to be more effective for enhancing explosive power and peak output, whereas percentage-based resistance training is more effective for improving mean power and endurance performance.30 Therefore, optimizing body composition (by increasing muscle mass and reducing fat mass) and specifically targeting improvements in key power indicators are of critical importance for enhancing the overall athletic performance of female basketball players.28–30
This study aims to investigate the efficacy of power bicycle training for improving the anaerobic exercise ability of female basketball players. Additionally, this study explores the quantitative relationship between cost-effective measurement indices, such as lower-limb circumference, lower-limb muscle mass, and power bicycle evaluation index, and attempts to establish an algorithm model.
MethodsParticipantsThe participants were 47 randomly selected outstanding female basketball players who represented Hainan Province in the National College Student Basketball League between 2024 and 2025. The inclusion criteria were (1) students who were registered and enrolled in the school’s Student Management Center as of September 1, 2025, and (2) students who provided informed consent and voluntarily participated in the study. Individuals with cardiovascular diseases or other conditions that would prevent them from completing high-intensity power cycling training were excluded. The Ethics Committee of **College approved this study (Approval no Hnky2021-41). All methods were performed in accordance with the relevant guidelines, and all participants provided written informed consent.
MethodsGrouping methodThe study participants (N = 47) were divided into two groups based on their performance in the anaerobic power cycling tests. The results were compared using the independent-samples t-test, which indicated that the baseline anaerobic capacity was comparable between the groups. Key indicators of anaerobic capacity were not significantly different between the two groups (p > 0.05), confirming the homogeneity of the groups. Therefore, the participants were formally assigned to the control group (n = 23) and the training group (n = 24). The scientific rigor and validity of the grouping process provided a reliable foundation for the subsequent experiment, ensuring the objectivity of the results.
Basic information collectionThe general demographic data, including age, sex, height, weight, and body mass index, were collected from the 47 study participants using a questionnaire developed specifically for this study.
Body composition testingA professional tester independently measured the body composition of the study participants in all four quarters using a body composition analyzer (InBody 720, Korea).
Lower-limb morphology measurementTwo professionals independently performed lower-limb morphology measurements. Before the test, the participants were briefed on the relevant testing approaches and precautions. For the measurement of thigh circumference, the participants stood with their legs shoulder-width apart, ensuring an even distribution of body weight between both legs. Thigh circumference was measured using a measuring tape at the half-distance between the greater trochanter and the lateral condyle of the femur.35,36
For calf circumference, measurements were taken at the thickest part of the calf. These measurements were taken one day before the first anaerobic power cycling session in each quarter and continued until one day after the last session, with measurements taken before each training session.
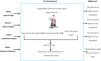
Anaerobic power bicycle training programThe anaerobic power cycling training program is illustrated in Fig. 1. All 24 female basketball players performed anaerobic power cycling training one month in advance, twice per week before each quarter. Each player warmed up and pedaled for 120 s before pedaling for 30 s and resting for 300 s per cycle, with a total of four cycles. Each player underwent anaerobic power bicycle training 28 times before the seasons.37,38

For the statistical analysis of anaerobic power cycling training data, repeated-measures one-way analysis of variance (ANOVA) and repeated-measures two-way ANOVA are commonly used and widely recognized methods in international sports science research. Repeated-measures one-way ANOVA is suitable for evaluating changes in anaerobic power metrics within the same group of participants across different time points (e.g., pre- and post-training or across different quarters). This method effectively identifies the impact of time as a factor while controlling for inter-individual variability.23 Repeated-measures two-way ANOVA is appropriate for simultaneously evaluating the effects of two independent variables (e.g., training group and training session) on anaerobic power, as well as their interaction. It is particularly useful for analyzing performance differences between the training and control groups across different training sessions.2 The Least Significant Difference (LSD) post hoc test is a commonly applied multiple comparison method used after obtaining a significant ANOVA result to identify which specific group differences are statistically significant.2 These statistical techniques are widely applied in the fields of anaerobic power cycling training, exercise physiology, and physical fitness assessment, providing robust support for the scientific evaluation of training effects and training program optimization.9,23
To validate the effectiveness of the annual anaerobic power cycling training program, the average values of the anaerobic power cycling metrics were compared between the control and training groups before training in the four quarters to determine if there were any statistically significant differences. Similarly, the average changes in the anaerobic power cycling indicators were compared between the control and training groups for the four quarters before and after training. Repeated-measured one-way ANOVA was used for the statistical analysis. Subsequently, the average values of the anaerobic power cycling metrics for each of the four sessions within every quarter were calculated, which served as the training levels for sessions 1–7 in each quarter. Furthermore, the average values of the metrics in sessions 1–7 in each of the four quarters were computed, representing the changes in the metrics between the training sessions. Verification was conducted using repeated-measures two-way ANOVA, and the most effective training session was determined using the LSD post hoc test.
Data processing methodTwo individuals entered and cross-verified the data. The mean value was used as a replacement in cases where less than one third of the data were missing. The data were excluded if the missing content exceeded one third. Microsoft Excel was used to organize the entered data, and SPSS 22.0 software was used for the data analysis. Descriptive statistics, including frequency and percentage, were used to express the general information of the participants, and normally distributed quantitative data are presented. Pearson’s correlation analysis was conducted to assess the correlation between lower-limb muscle mass, thigh circumference, calf circumference, and anaerobic exercise performance metrics. Multivariate linear regression analysis was used to establish the algorithm formula for lower-limb morphology, muscle mass metrics, and anaerobic exercise performance metrics of the female basketball players. The significance level for hypothesis testing of the measurement indicators was set at p < 0.05.
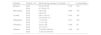
ResultsTable 1 presents the baseline information of the participants. Table 2 presents the average Wingate test metrics for the control group and the training group before the four quarterly training cycles. The two groups exhibited no significant differences in mean power, peak power, fatigue index, peak power/body weight, mean power/body weight, and total work (p > 0.05). Table 3 shows the comparative analysis of the changes in Wingate metrics before and after the four training cycles in both groups. The changes in mean power and peak power/body weight before and after the four cycles were significantly different between the control and training groups (all p < 0.05). Further analysis indicated that the training group exhibited significantly greater changes in Wingate metrics, particularly mean power and peak power/body weight.
Demographic and baseline characteristics of female basketball players.
Values are expressed as the mean (SD). BMI, body mass index; SD, standard deviation.
Comparative analysis of the average values of Wingate metrics between the control and training groups before the four (quarterly) training sessions.
Data are presented as the mean (SD). A, control group; B, training group; FI, fatigue index; MP, mean power; MW, mean power/body weight; PP, peak power; PW, peak power/body weight; SD, standard deviation; TW, total work.
Comparative analysis of the changes in Wingate indicators after compared with before the four (quarterly) training sessions between the control and training groups.
Values are presented as the mean (SD). A, control group; B, training group; FI, fatigue index; MP, mean power; MW, mean power/body weight; PP, peak power; PW, peak power/body weight; SD, standard deviation; TW, total work.
The effects of annual power cycling training were calculated through one-way ANOVA (Table 4). The mean power, peak power, peak power index, fatigue index, peak power/body weight, mean power/body weight, and total work were significantly different between the groups (all p < 0.05). Specifically, the differences between sessions 5 and 6 and sessions 1 and 3 were significantly more pronounced in female basketball players who underwent anaerobic power cycling training (p < 0.05). As the number of training cycles increased, the performance of the athletes improved in terms of average power, maximum power, minimum power, mean power/body weight, peak power/body weight, and total work. However, during session 6, anaerobic power decreased to the lowest point, indicating that the athletes approached their physical limits and were unable to sustain additional output. In exercise physiology, when the exercise intensity reaches a certain threshold, the body’s energy systems, especially the anaerobic metabolic system (such as the ATP and phosphocreatine systems in the muscles), are greatly challenged. At this stage, the muscles become fatigued and the energy supply begins to deplete, leading to a decline in power output. Thus, the lowest value typically represents the point at which the physiological limit is reached and an athlete achieves the highest performance under high-intensity exercise conditions. This reflects athletes’ recovery and maximum effort performance after high-intensity exercise, during which female basketball players showcase the strongest capabilities.
Effect of power bicycle training on Wingate indicators.
The p value was obtained by univariate ANOVA. Values are presented as the mean (SD). FI, fatigue index; MIP, minimum power; MP, mean power; MW, mean power/body weight; PP, peak power; PPI, peak power in; PW, peak power/body weight; TW, total work.
The correlation analyses between anaerobic power cycling metrics and lower-limb morphology in female basketball players indicated significant positive correlations of mean power, peak power, fatigue index, and total work with right leg skeletal muscle mass, left leg skeletal muscle mass, left thigh circumference, right thigh circumference, left calf circumference, and right calf circumference (all p < 0.001; Table 5). Additionally, peak power/body weight showed significant positive correlations with right leg skeletal muscle mass, left leg skeletal muscle mass, left thigh circumference, and right calf circumference (all p < 0.001).
Correlation analysis between anaerobic power bicycle metrics and lower-limb morphology indices in female basketball players.
FI, fatigue index; LCC, left calf circumference; LL, skeletal muscle mass of the left leg; LTC, left thigh circumference; MIP, minimum power; MP, mean power; MW, mean power/body weight; PP, peak power; PPI, peak power in; PW, peak power/body weight; RL, skeletal muscle mass of the right leg; RCC, right calf circumference; RTC, right thigh circumference; TW, total work. **p < 0.001.
Based on the formula in Table 6 for predicting the maximum anaerobic cycling power based on lower-limb morphology in female basketball players, the following predictive equations were derived through the regression analysis: Peak power = −33.472 + (left leg skeletal muscle mass × 133.820) − (right calf circumference × 45.304) + (left thigh circumference × 23.670); Mean power = 16.337 + (right leg skeletal muscle mass × 51.745); Peak power/body weight = 15.386 + (left leg skeletal muscle mass × 1.100) − (right calf circumference × 0.887) + (left thigh circumference × 0.344); Fatigue index = −8.776 + (right leg skeletal muscle mass × 3.381).
Algorithm formula between the maximum power of anaerobic power cycling and lower-limb morphology indices in female basketball players.
FI, fatigue index; LL, skeletal muscle mass of the left leg; LTC, left thigh circumference; MP, mean power; PP, peak power; PW, peak power/body weight; RCC, right calf circumference; RL, skeletal muscle mass of the right leg.
These equations effectively predicted various metrics in female basketball players who underwent anaerobic power cycling training. The explanatory power of these equations for peak power, mean power, peak power/body weight, and fatigue index were 87.5 %, 83.9 %, 60.9 %, and 71.2 %, respectively. These results indicated that the lower-limb morphology indicators, particularly skeletal muscle mass and thigh circumference, were significantly associated with anaerobic power cycling metrics in female basketball players.
DiscussionEnhancing the anaerobic capacity of female basketball players is crucial to ensure their competitiveness. Power cycling training is a type of high-intensity anaerobic exercise that has been widely applied to improve the performance of athletes. It encompasses HIIT in which the load is gradually increased. This training maximizes the output capacity of the lower-limb muscles and enhances strength and explosive power. Understanding the effects of power cycling training on lower-limb anaerobic capacity in female basketball players is essential to improve their performance. A previous study showed that a 4-week circuit resistance training program in a hypoxic environment led to significant improvements in peak power and mean power (p < 0.05) among 16 male gymnasts.21 Similarly, other scholars evaluated the effects of various HIIT protocols on aerobic and anaerobic capacity, physiological adaptation, and muscle damage in young male basketball players. There were significant increases in mean power and peak power in the lower limbs in the HIIT group during the fourth full-power cycle (p < 0.05).22 Additionally, another study analyzed the effects of 8-week short interval training (SIT) in elite male badminton players. The study included 16 athletes who were randomly divided into an experimental group (SIT group, n = 8) and a control group (n = 8). The SIT group performed two power cycling SIT sessions and one multi-ball SIT session weekly, whereas the control group performed two regular physical training sessions and one multi-ball session. The SIT group exhibited a significant increase in mean power (p < 0.05), but there was a significant decrease in the time to peak power (p < 0.05).36,37
In the present study, the trend analysis indicated that the changes in Wingate metrics, especially mean and peak power/body weight, were significantly more pronounced in the training group. In addition, the anaerobic power cycling metrics exhibited significant differences between sessions 1 and 7 (p < 0.05). Statistical analysis showed significant differences in the anaerobic power cycling indices of female basketball players (p < 0.05), consistent with the findings of a previous study on the effects of HIIT protocols among basketball players. After undergoing anaerobic power cycling training, female athletes showed significant increases in both peak power and mean power after sessions 5 and 6, along with a decrease in fatigue index, indicating a significant improvement in anaerobic high-intensity endurance.
The present study also observed a significant positive correlation between thigh circumference and lower-limb muscle strength, as muscle strength is closely related to cross-sectional area (p < 0.001).20,21 This result is consistent with that of a study in patients with knee arthritis, which reported a strong positive correlation between quadriceps strength and thigh circumference (p < 0.001).22 In another study, training led to a significant increase in muscle strength in the quadriceps and hamstrings by week 8 (p < 0.05).23 The present study showed significant positive correlations of anaerobic power cycling metrics (mean power, peak power, minimum power, fatigue index, and total work) among female basketball players with both right and left leg skeletal muscle mass, thigh circumference, and calf circumference (p < 0.001), consistent with the findings of previous studies.20,21,23 This study also found that during anaerobic power cycling training or other HIIT, the muscles are subjected to greater stimulation, resulting in increased skeletal muscle tension. Initial strength gains are primarily due to neural stimulation, rather than physiological changes in the muscles.27 Muscle hypertrophy is mainly attributed to the increase in individual muscle fiber volume.28,29 After 4–8 weeks of resistance training or 2–3 weeks of high-intensity training, muscle fiber volume increases, accompanied by a significant increase in thigh circumference.30,31,32 The present study confirmed the positive correlation between thigh circumference and anaerobic power in the lower limbs.
In summary, the effectiveness of anaerobic power cycling training is influenced by multiple external factors, including temperature, humidity, and nutritional intake.33,34,35 Variations in training intensity, frequency, volume, and rest intervals also affect training outcomes. A quantitative analysis of the relationship between lower-limb circumference, muscle mass, and anaerobic power facilitate a more objective assessment of lower-limb strength in female basketball players.39,40,41 Although there are slight biases in the evaluation model owing to differences in the experimental populations, the results of this study showed high accuracy within the population studied. The equations presented in this study can assist coaches and trainers in customizing training evaluation models for specific groups, even when experimental equipment is unavailable or training conditions are suboptimal. This approach undoubtedly offers an efficient, time-saving, and cost-effective method for assessing training effectiveness and outcomes, with significant practical value. However, as this study only included female players, it is important to investigate the generalizability of the findings to male players. Additionally, the limitations of the study should be discussed, and future research directions should explore the applicability of these findings across different populations.
ConclusionsThe anaerobic exercise ability of female basketball players in the four quarters of the year did not differ significantly. The anaerobic exercise ability of female basketball players reached the highest level through 5–6 training sessions, twice per week, before the game. The anaerobic exercise ability of female basketball players could be accurately predicted according to the proposed multiple linear regression equations. This prediction method is undoubtedly a time-saving, labor-saving, and efficient evaluation tool, and it may be useful for guiding practical training.
- 1.
Optimization of Training Schedules: This study clearly indicated that female basketball players significantly improved their anaerobic capacity by training twice per week for a total of 5–6 sessions prior to competing. Coaches can utilize this information to rationally plan the training frequency and intensity before games, ensuring athletes reach their optimal physical condition.
- 2.
Personalized Training Programs: Based on multiple linear regression equations, coaches can accurately predict athletes’ anaerobic performance and subsequently develop individualized and scientifically grounded training plans. This approach allows coaches to tailor the training content and intensity to each athlete’s specific needs, thereby enhancing training effectiveness.
- 3.
Time and Resource Efficiency: The prediction model based on the regression equations saved considerable time and effort. Coaches are no longer reliant on complex physical assessments or prolonged observation periods; instead, they can rapidly assess athletes’ physical fitness using a simple mathematical model, enabling swift adjustments and maximizing training efficiency.
- 4.
Improved Training Outcomes: Through the application of scientific prediction and evaluation tools, coaches can gain more precise insights into the physical status of athletes. This helps to avoid both overtraining and undertraining, ensuring athletes reach peak condition before competitions and improving overall training outcomes and performance.
- 5.
Practical Guidance Value: This research provides strong data-driven support for practical training, enabling coaches to monitor athletes’ training progress through quantitative analysis. Adjustments can be made according to different training phases, ultimately achieving simultaneous improvements in physical capacity and competitive performance.
Haoyang Ding and Shuai Zhao collected the data, Jiameng Wang conducted the data analysis, Ruixue Zhao provided experimental guidance, and Jiameng Wang and Shuai Zhao completed the manuscript writing and the revision of important content.
FundingThis study was funded by Supported by 2022 Hainan Province Philosophy and Social Science Planning project (HNSK(QN)22-84); 2023 Hainan Province Philosophy and Social Science Planning project: HNSK(YB)23-58; 2023 Yan'an University PhD Funding Project, Project Number (YAU-G20230101); 2020 Research Start-up Fund Project of Hainan University (kyqd(sk)2012); 2025 Shaanxi Provincial Sports Science Regular Research Project (20250625).
Ethics approval and consent to participateThe Ethics Committee of Hainan Medical College approved this study (Approval No. Hnky2021-41), and all participants provided informed consent.
Consent for publicationNot applicable.
The authors declare no competing interests.
We appreciate the linguistic assistance provided by TopEdit (www.topeditsci.com) during the preparation of this manuscript.