

High-intensity interval training (HIIT) has previously been reported having the effect of training period on altering oxidant status, muscle damage and performance. The present study was aimed to understand and evaluate the adaptive response of 8 weeks HIIT on muscle damage indices, inflammatory markers, oxidative stress variables and physical fitness parameters.
MethodsForty young endurance male players [i.e., football (n=20) and field hockey (n=20)] were recruited under two groups i.e., control and HIIT. 8 weeks long 3h/day of sprint-HIIT was intervened for thrice/week. HIIT workouts includes total 4 sets/session (divided into 2 phase×2 sets×2min) of all-out sprint workout (at 90–95% of HRmax with work: rest=1:1). Muscle damage indices (CK and LDH), inflammatory markers (IL-6 and TNF-α), oxidative stress variables (MDA, SOD, GSH and GPx) and physical fitness variables (VO2max, Wpeak and VJ) were assessed via following standard protocols.
ResultThe HIIT resulted to significantly(p<0.001) increase BMI (1.1%), LDH (15.0%), CK (14.4%), cortisol (9.4%), IL-6 (15.7%), TNF-α (18.2%), MDA (29.5%), VO2max (13.6%), Wpeak (11.6%), VJ (11.2%) and GPx (0.4%) along with significant (p<0.001) reduction in BF% (7.6%), SOD (11.1%), GSH (10.8%) content of athletes.
ConclusionAntioxidant redox imbalance confers inflammatory oxidative stress condition which further leads to muscle damage and that may cause due to HIIT induced temporary hypoxic condition which contrarily induced overtraining effect but with improving performance variables.
High-intensity interval training (HIIT), in a variety of forms, is one of the most effective time-efficient strategies to improve cardiorespiratory and metabolic function and ultimately optimize physical performance.1 In general, HIIT protocol involves alternate bouts of intense exercise workout (approx 85–90% VO2max) followed by rest or low-intensity recovery periods and may develop both the aerobic and anaerobic system at the same time.1–3 In other words, HIIT is believed as an optimal stimulus to push the threshold limit of maximal cardiovascular and peripheral adaptations by spending several minutes in ‘red zone’ under training in terms of both>90% VO2max and HRmax.1 Gibala and McGee (2008) suggested that HIIT is an effective alternative to traditional endurance training to induce similar or even superior changes in physiological, performance and health-related markers in both healthy and diseased populations.2
Muscle damage is a high-intensity training or over-training induced condition where intramuscular proteins appear in the blood due to microtrauma in the muscle cell membrane with a drop in muscle speed, power and flexibility.4 Creatine kinase (CK) and lactate dehydrogenase (LDH) are suitable indicators of muscle damage since they start to accumulate in the blood due to the exercise-induced regional necroses in muscle fibers.5,6 Previously a significant increase in CK and LDH after acute high-intensity training (≥80% VO2max) was observed where values even remain at an elevated level after 24h of post-exercise.4,5
Interleukin-6 (IL-6) and tumour necrosis factor-α (TNF-α) induce the inflammatory cascade following any high-intensity workout with sympathetic stimulation.7 IL-6 and TNF-αfound higher immediately after theexercise8,9 even 48h of post-exercise10 than their resting values. The post-exercise IL-6 increase may induce the onset of muscle soreness especially following an eccentric or high-intensity exercise (HIE).8,10
Both short-term and long-term HIIT induced alteration in redox equilibrium has been reported due to continuous production of reactive oxygen species (ROS) in the skeletal muscle bed and this leads to rising in lipid peroxidation by disrupting the scavenging property of antioxidant enzymes.11–13 Evidence suggested that exercise may positively or negatively induce the degree of oxidative stress depending on the specificity, load, intensity, and duration of the training.11–14 On the other hand, Sousa et al. (2016) has reported that regardless of intensity, volume, type of exercise, antioxidant indicators tended to increase with a concomitant decrease in pro-oxidant indicators following training.15
The effect of high-intensity interval exercise on muscle damage, oxidative stress and inflammatory markers, have been reported in earlier studies.4,5,8,12,16 But these studies have documented the single exercise bout induced changes in these parameters. Studies are lacking on the effects of HIIT training period (long-term/longitudinal effect) on these parameters. Therefore, the present study was aimed to investigate the effects of 8 weeks sprint HIIT on muscle damage indices, inflammatory markers, oxidative stress and physical fitness variables in young team-game players. It is hypothesized that HIIT may impose muscle damage, inflammation and oxidative stress condition along with optimizing the athletics performance and may not be beneficial for long-term training adaptations.
Materials and methodsSubject selectionForty young Indian male team-game players [i.e., football (FB, n=20) and field hockey (HOC, n=20)] were recruited as the subject in the present study. They were divided equally into two age-matched groups i.e., (i) control group (mean age=16.78±1.28yrs) and HIIT group (mean age=16.67±1.09yrs) by using a fixed randomization scheme generated by the Moses–Oakford algorithm. Participants had minimum of 5 years of professional training experience and recruited only after clinical examination. Written informed consent was obtained from each subject and the study protocol conforms to the ethical guidelines of the Declaration of Helsinki, 1975. Ethical clearance (Ref No. IHEC/AB/P82/2019) was obtained from the Institutional Human Ethical Committee (IHEC), Department of Physiology, University of Calcutta.
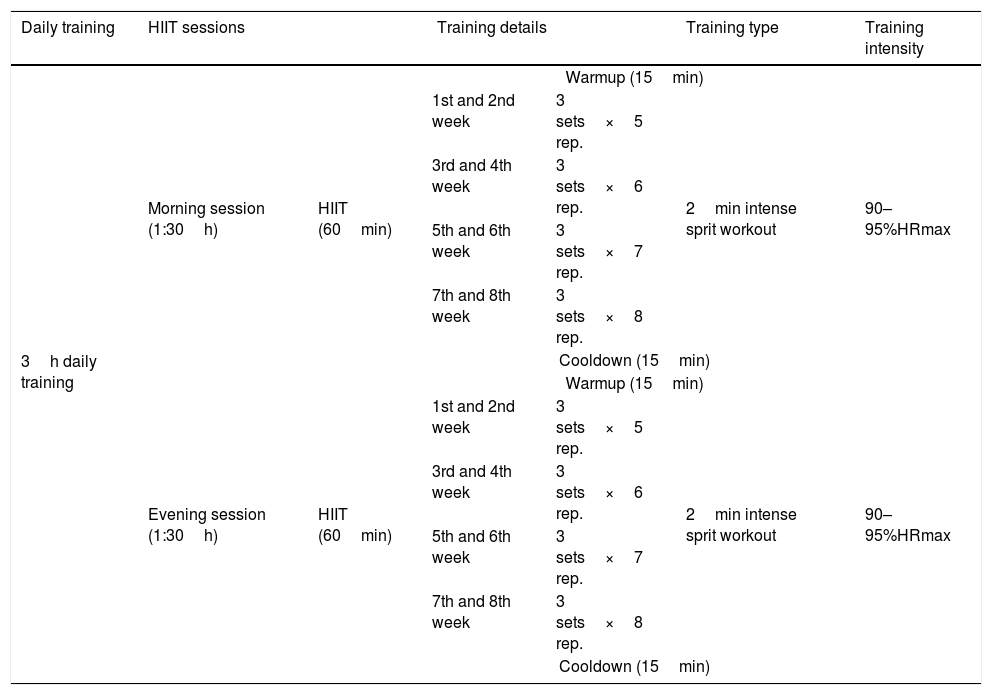
Detailed training programThree hours of HIIT (sprint intervals) practice was intervened for thrice a week in alternate days (i.e., Monday, Wednesday, and Friday) and continued for a total duration of 8 weeks. The formulation and implementation of the HIIT protocol were done by the qualified coaches under the guidance of scientific experts. Daily 3h HIIT was divided into two sessions [both morning and evening sessions of 90min each]. Each 90min training phase started with a warmup session and ended with a cool-down session (each session consisted of 15min slow running at an intensity of 50% of HRmax). During the HIIT (total 60min/morning or evening session), subjects were asked to perform 3 all-out HIIT sets. Each small HIIT set consisted of 2min intense sprint workout (at 90–95% of HRmax) followed by 1min active recovery (60–70% HRmax) which was followed by 1min of complete rest. Thus, the whole training workload had a work-rest ratio of 1:1. Finally, each 2min intense sprint workout set was intervened with a brief stride of repetition maximum (rep.) running in increasing manner throughout the 8 weeks i.e., 5 rep. in 1st–2nd week, 6 rep. in 3rd–4th week, 7 rep. in 5–6th week and 8 rep. in 7–8th week.
On the other hand, the control group players continued systematic low volume physical training for 3h per day which included lower intensity (training load at 60–70% HRmax) physical activity (i.e., stretching, jogging, low-intensity running etc) for three days a week (on the alternate basis) till the 8 weeks interval to match the HIIT training duration. Lower intensity physical activity was done to avoid the detraining effect. Whereas the game-specific (football and hockey) trainings along with the skill training (i.e., dribbling, passing, hit/shooting, tackles, movement techniques etc) were done by all the players of both HIIT and control groups on alternate days of practice (Table 1).
Details of training programme including type, sessions, intensity of exercise.
| Daily training | HIIT sessions | Training details | Training type | Training intensity | ||
|---|---|---|---|---|---|---|
| 3h daily training | Morning session (1:30h) | Warmup (15min) | ||||
| HIIT (60min) | 1st and 2nd week | 3 sets×5 rep. | 2min intense sprit workout | 90–95%HRmax | ||
| 3rd and 4th week | 3 sets×6 rep. | |||||
| 5th and 6th week | 3 sets×7 rep. | |||||
| 7th and 8th week | 3 sets×8 rep. | |||||
| Cooldown (15min) | ||||||
| Evening session (1:30h) | Warmup (15min) | |||||
| HIIT (60min) | 1st and 2nd week | 3 sets×5 rep. | 2min intense sprit workout | 90–95%HRmax | ||
| 3rd and 4th week | 3 sets×6 rep. | |||||
| 5th and 6th week | 3 sets×7 rep. | |||||
| 7th and 8th week | 3 sets×8 rep. | |||||
| Cooldown (15min) | ||||||
Physical characteristics i.e., standing height (cm) and body weight (kg) were measured by using Seca Alpha stadiometer (model – 213, Seca Deutschland, Germany) and Seca Alpha weighing scale (model – 770, Seca Deutschland, Germany) respectively.17 Body mass index (BMI) was calculated by using standard formula.17 Body fat % (BF%) was calculated by using the formula of Brozek et al. (1963) after measuring the skinfold thickness at the site of biceps, triceps, subscapular, supra-illiac.18
Biochemical analysisProcess of blood collection and plasma sample preparationBlood samples were collected at 6:00–8:00AM from the antecubital vein for serum preparation (without anticoagulant) in the pre-prandial state (after 8–10h of fasting) to avoid possible differences due to diurnal variation. Samples were then centrifuged (REMI centrifuge, R-8C) at 3000rpm for 15min at 4°C to ensure complete separation of serum.19 Blood sample collections were measured in both pre- and post-training phases under homogeneous laboratory environment (room temperature, 23–25°C; relative humidity, 50–60%).
Assay for skeletal muscle damage indices (CK-MB, LDH and cortisol)Creatine kinase (CK) and lactate dehydrogenase (LDH) activity were estimated from serum sample analyzed via ELISA method and an Advia 1650 analyzer (Siemens Healthcare Diagnostics, Deerfield, IL, USA).20 Cortisol was measured using the competitive immunoassay kit (Salimetrics, State College, PA, USA). Bound Cortisol Enzyme Conjugate was measured by the reaction of peroxidase enzyme to the substrate tetramethylbenzidine and finally, optical density was measured at 450nm.21
Assessment of IL-6, TNF-αCommercially available 96-well ELISA kits were used to measure the protein levels of IL-6 (Diaclone SAS., Besancon Cedex, France) and TNF-α (Diaclone SAS., Besancon Cedex, France) in the serum. The assay was performed according to the manufacturer's instructions. The absorbance of IL-6 and TNF-α was measured at 620nm by an Anthos 2020 microplate reader (Biochrom Co., England). Each sample was assayed in duplicate and data were expressed as picograms per millilitre serum.22
Assay for antioxidant status (MDA, SOD, GSH, GPx)Malondialdehyde (MDA) was measured by reacting with thiobarbituric acid (TBA) to form TBA-MDA under acidic conditions at an elevated temperature at 532nm and expressed as μmoles of MDA/100ml serum. Superoxide dismutase (SOD) was estimated by inhibiting the auto-oxidation of pyrogallol at 420nm. The SOD activity was expressed as U/min/mg protein and 1U of the enzyme is defined as the enzyme activity that inhibits auto-oxidation of pyragallol by 50%. Reduced glutathione (GSH) content was estimated form a yellow coloured complex after reacting to DTNB with an absorbance maximum at 412nm and expressed as mg/100ml serum. The glutathione peroxidase (GPx) enzyme degrades the H2O2 in presence of GSH. The remaining GSH was measured via its reaction with DTNB. GPx activity was expressed as μMoles of GSH consumed/min/mg protein. All oxidative stress markers (MDA, SOD, GSH, GPx) were measured via following the standard procedure of Kuyumcu and Aycan (2019).19 Protein estimation was done by following the method of Lowry et al., (1951) where Folin-Ciocalteau reagent used to produce a blue-purple coloured complex, with maximum absorption at 660nm.23
Physical fitness variablesMaximal oxygen consumption (VO2max) was measured by using an incremental exercise protocol on a bicycle ergometer (Ergoline, VIA Sprint 150P, Germany). Where athletes were asked to start pedaling without any load for 1st min, and initially 25-W workload was applied for 2min and then progressively increasing the load by 25W in every 2min interval until complete exhaustion.17 During the incremental test, breath by breath automated pre-calibrated metabolic gas analyzer (MetaMax 3B, CORTEX Biophysik GmbH, Leipzig, Germany) was used to determine the VO2max by maintaining the following criteria: (i) a plateau in VO2 (2ml/kg/min) despite increasing the workload, (ii) respiratory exchange ratio (RER)≥1.1, (iii) >90% of age-predicted HRmax±5%, (iv) voluntary exhaustion.17,24 Relative anaerobic peak power (Wpeak) were predicted from measuring the absolute peak anaerobic power by using the running-based anaerobic sprint test (RAST). Where participants were asked to perform six consecutive sprints at maximal speed over the distance of 35m with a 10s rest period between each sprint. Timing of each sprint was recorded by using timing gate system.17 Vertical jump (VJ) was measured to assess the leg explosive strength. Where athletes were asked to jump as high as possible from a standing position beside a wall with holding one hand high above. The distance between the initial and final mark was measured to the nearest 0.1cm and two attempts were given to each athlete.17 Polar heart rate monitor (Polar RS800CX, Polar Electro OY, Kempele, Finland) was used to measure the HRmax throughout the whole exercise protocol.17 All fitness variables were measured in both pre- and post-training phases and tried to take records of all tests in the same day and the same field/laboratory at room temperature varying from 26 to 30°C with the relative humidity varying between 50 and 60%.
Statistical analysisData were analyzed by using Statistical Package for the Social Sciences (SPSS) version 18.0 (SPSS Inc., Chicago, Il, USA). A 95% confidence interval was considered as the level of significance. Normality of distribution was checked via the Shapiro–Wilk's test. All the data have been presented as mean±standard deviation (SD). Two-tail paired t-test was used to determine the difference between the means of pre- and post-intervention data. Two-way/mixed ANOVA was also introduced to check the main effect of group and moment among all the groups at a time. Pearson's product-moment correlation, simple regression analysis and analysis of % change were also performed for better interpretation of the data.
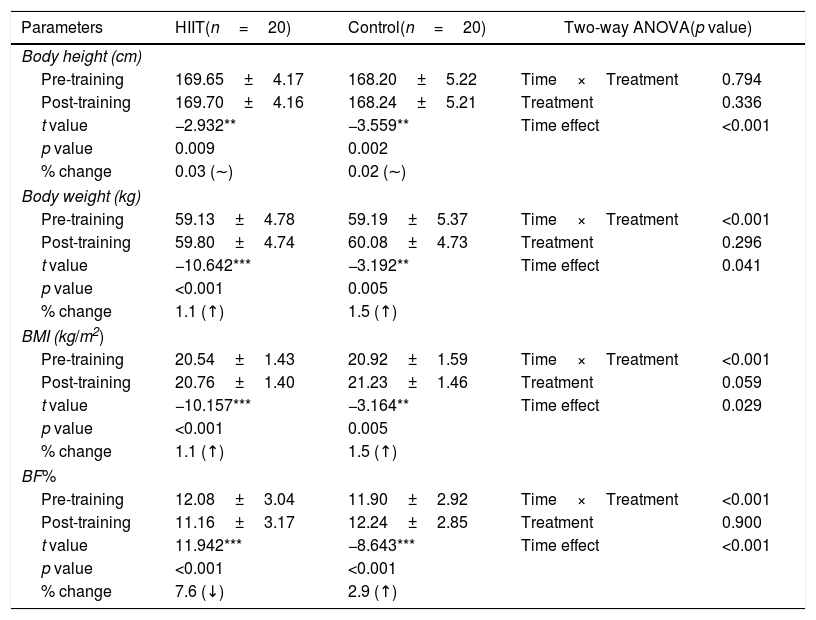
ResultsEffect of HIIT induced changes on anthropometric parameters have been represented in Table 2. Bodyweight, BMI, and BF% were significantly (p<0.001) decreased in post-training HIIT group when compared with pre-training data. On the other hand, body weight, BMI, and BF% were significantly (p<0.001) increased in the control group after the intervention period Body height increased significantly (p<0.05) in post-intervention data in both the groups. Two-way ANOVA depicted significant result in both the time×treatment effect and time only effect in body weight, BMI and BF%. Additionally, body height revealed the time only effect in a significant manner.
Comparison of anthropometric variables between pre- and post-HIIT intervention phases.
| Parameters | HIIT(n=20) | Control(n=20) | Two-way ANOVA(p value) | |
|---|---|---|---|---|
| Body height (cm) | ||||
| Pre-training | 169.65±4.17 | 168.20±5.22 | Time×Treatment | 0.794 |
| Post-training | 169.70±4.16 | 168.24±5.21 | Treatment | 0.336 |
| t value | −2.932** | −3.559** | Time effect | <0.001 |
| p value | 0.009 | 0.002 | ||
| % change | 0.03 (∼) | 0.02 (∼) | ||
| Body weight (kg) | ||||
| Pre-training | 59.13±4.78 | 59.19±5.37 | Time×Treatment | <0.001 |
| Post-training | 59.80±4.74 | 60.08±4.73 | Treatment | 0.296 |
| t value | −10.642*** | −3.192** | Time effect | 0.041 |
| p value | <0.001 | 0.005 | ||
| % change | 1.1 (↑) | 1.5 (↑) | ||
| BMI (kg/m2) | ||||
| Pre-training | 20.54±1.43 | 20.92±1.59 | Time×Treatment | <0.001 |
| Post-training | 20.76±1.40 | 21.23±1.46 | Treatment | 0.059 |
| t value | −10.157*** | −3.164** | Time effect | 0.029 |
| p value | <0.001 | 0.005 | ||
| % change | 1.1 (↑) | 1.5 (↑) | ||
| BF% | ||||
| Pre-training | 12.08±3.04 | 11.90±2.92 | Time×Treatment | <0.001 |
| Post-training | 11.16±3.17 | 12.24±2.85 | Treatment | 0.900 |
| t value | 11.942*** | −8.643*** | Time effect | <0.001 |
| p value | <0.001 | <0.001 | ||
| % change | 7.6 (↓) | 2.9 (↑) | ||
Values are mean±SD. *p<0.05, ** p<0.01, *** p<0.001, NS=not significant, HIIT=high-intensity interval training, BMI=Body mass index, BF %=body fat percentage.
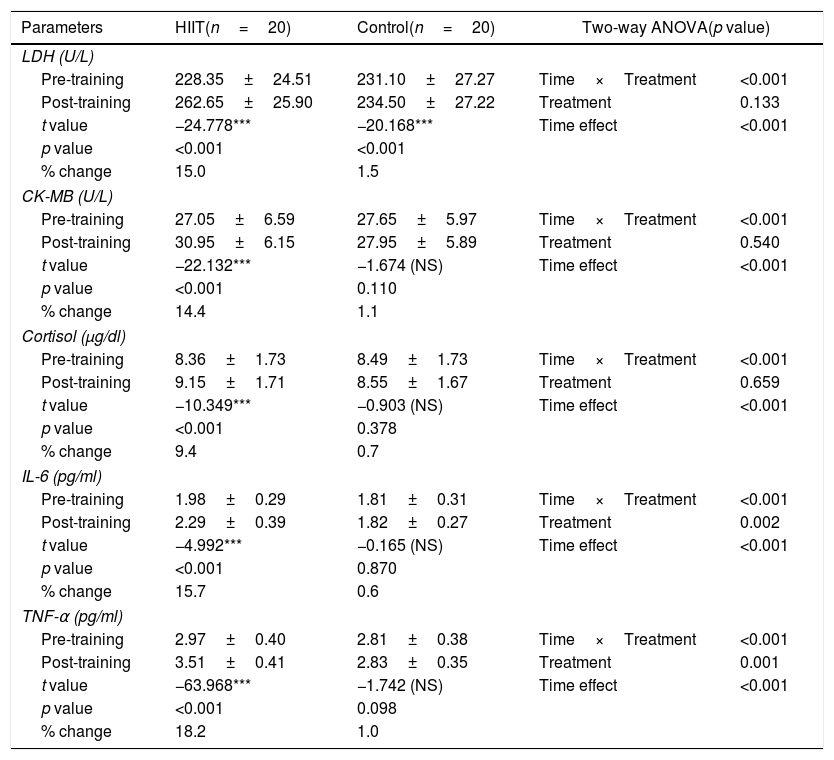
Effect of HIIT induced changes on skeletal muscle damage indices and inflammatory markers have been represented in Table 3. Significant increase in LDH, CK-MB, cortisol, IL-6 and TNF-α were observed in following HIIT in the experimental group. On the other hand, only LDH was found to be significantly (p<0.001) increased in the control group after the intervention period. Two-way ANOVA depicted significant result in both the time×treatment effect and time only effect in LDH, CK-MB, cortisol, IL-6 and TNF-α. Additionally, significant treatment only effect was observed in IL-6 and TNF-α.
Comparison of skeletal muscle damage indices, inflammatory markers, and cortisol level between pre- and post-HIIT intervention phases.
| Parameters | HIIT(n=20) | Control(n=20) | Two-way ANOVA(p value) | |
|---|---|---|---|---|
| LDH (U/L) | ||||
| Pre-training | 228.35±24.51 | 231.10±27.27 | Time×Treatment | <0.001 |
| Post-training | 262.65±25.90 | 234.50±27.22 | Treatment | 0.133 |
| t value | −24.778*** | −20.168*** | Time effect | <0.001 |
| p value | <0.001 | <0.001 | ||
| % change | 15.0 | 1.5 | ||
| CK-MB (U/L) | ||||
| Pre-training | 27.05±6.59 | 27.65±5.97 | Time×Treatment | <0.001 |
| Post-training | 30.95±6.15 | 27.95±5.89 | Treatment | 0.540 |
| t value | −22.132*** | −1.674 (NS) | Time effect | <0.001 |
| p value | <0.001 | 0.110 | ||
| % change | 14.4 | 1.1 | ||
| Cortisol (μg/dl) | ||||
| Pre-training | 8.36±1.73 | 8.49±1.73 | Time×Treatment | <0.001 |
| Post-training | 9.15±1.71 | 8.55±1.67 | Treatment | 0.659 |
| t value | −10.349*** | −0.903 (NS) | Time effect | <0.001 |
| p value | <0.001 | 0.378 | ||
| % change | 9.4 | 0.7 | ||
| IL-6 (pg/ml) | ||||
| Pre-training | 1.98±0.29 | 1.81±0.31 | Time×Treatment | <0.001 |
| Post-training | 2.29±0.39 | 1.82±0.27 | Treatment | 0.002 |
| t value | −4.992*** | −0.165 (NS) | Time effect | <0.001 |
| p value | <0.001 | 0.870 | ||
| % change | 15.7 | 0.6 | ||
| TNF-α (pg/ml) | ||||
| Pre-training | 2.97±0.40 | 2.81±0.38 | Time×Treatment | <0.001 |
| Post-training | 3.51±0.41 | 2.83±0.35 | Treatment | 0.001 |
| t value | −63.968*** | −1.742 (NS) | Time effect | <0.001 |
| p value | <0.001 | 0.098 | ||
| % change | 18.2 | 1.0 | ||
Values are mean±SD, *=p<0.05, **=p<0.01, ***=p<0.001, NS=not significant, HIIT=high-intensity interval training, LDH=lactate dehydrogenase, CK-MB=creatine kinase (MB isoenzyme), IL-6=interleukin-6, TNF-α=tumor necrosis factor (alpha).
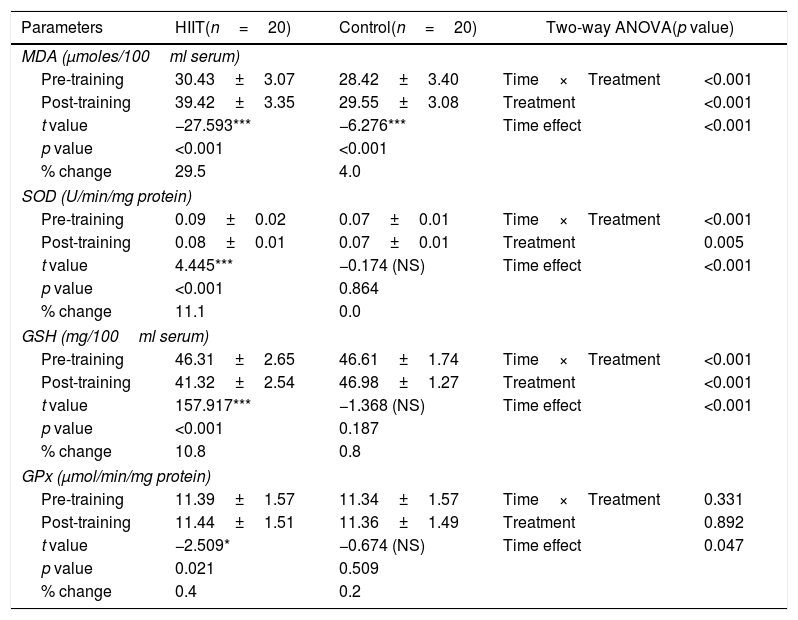
Effects of HIIT induced changes on oxidative stress markers have been represented in Table 4. Significant increase in MDA, GPx and decrease in SOD, GR were observed following HIIT in the experimental group. Control group showed a significant (p<0.001) increase in MDA following the intervention period. Two-way ANOVA depicted significant result in all three time×treatment effect, treatment only effect and time only effect in MDA, SOD and GSH.
Comparison of oxidative stress markers between pre- and post-HIIT intervention phases.
| Parameters | HIIT(n=20) | Control(n=20) | Two-way ANOVA(p value) | |
|---|---|---|---|---|
| MDA (μmoles/100ml serum) | ||||
| Pre-training | 30.43±3.07 | 28.42±3.40 | Time×Treatment | <0.001 |
| Post-training | 39.42±3.35 | 29.55±3.08 | Treatment | <0.001 |
| t value | −27.593*** | −6.276*** | Time effect | <0.001 |
| p value | <0.001 | <0.001 | ||
| % change | 29.5 | 4.0 | ||
| SOD (U/min/mg protein) | ||||
| Pre-training | 0.09±0.02 | 0.07±0.01 | Time×Treatment | <0.001 |
| Post-training | 0.08±0.01 | 0.07±0.01 | Treatment | 0.005 |
| t value | 4.445*** | −0.174 (NS) | Time effect | <0.001 |
| p value | <0.001 | 0.864 | ||
| % change | 11.1 | 0.0 | ||
| GSH (mg/100ml serum) | ||||
| Pre-training | 46.31±2.65 | 46.61±1.74 | Time×Treatment | <0.001 |
| Post-training | 41.32±2.54 | 46.98±1.27 | Treatment | <0.001 |
| t value | 157.917*** | −1.368 (NS) | Time effect | <0.001 |
| p value | <0.001 | 0.187 | ||
| % change | 10.8 | 0.8 | ||
| GPx (μmol/min/mg protein) | ||||
| Pre-training | 11.39±1.57 | 11.34±1.57 | Time×Treatment | 0.331 |
| Post-training | 11.44±1.51 | 11.36±1.49 | Treatment | 0.892 |
| t value | −2.509* | −0.674 (NS) | Time effect | 0.047 |
| p value | 0.021 | 0.509 | ||
| % change | 0.4 | 0.2 | ||
Values are mean±SD, *=p<0.05, **=p<0.01, ***=p<0.001, NS=not significant, HIIT=high-intensity interval training, MDA=malondialdehyde, SOD=superoxide dismutase, GSH=glutathione, GPx=glutathione peroxidase.
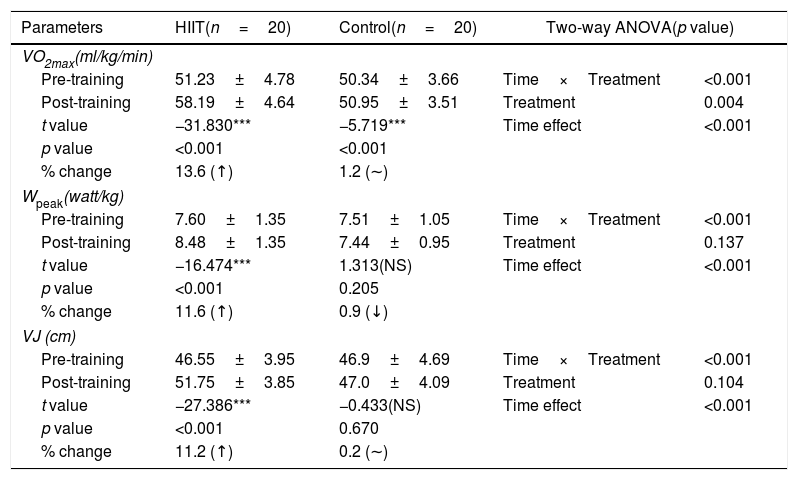
Effects of HIIT induced changes on some selected physical fitness parameters have been represented in Table 5. Significant (p<0.001) increase in VO2max, Wpeak and VJ were observed following training in post-training HIIT group in comparison to their respective pre-training values. Two-way ANOVA depicted significant result in both time×treatment effect and time only effect in VO2max, Wpeak and VJ. Additionally, significant treatment only effect was observed in VO2max only.
Comparison of selective physical fitness variables between pre- and post-HIIT intervention phase.
| Parameters | HIIT(n=20) | Control(n=20) | Two-way ANOVA(p value) | |
|---|---|---|---|---|
| VO2max(ml/kg/min) | ||||
| Pre-training | 51.23±4.78 | 50.34±3.66 | Time×Treatment | <0.001 |
| Post-training | 58.19±4.64 | 50.95±3.51 | Treatment | 0.004 |
| t value | −31.830*** | −5.719*** | Time effect | <0.001 |
| p value | <0.001 | <0.001 | ||
| % change | 13.6 (↑) | 1.2 (∼) | ||
| Wpeak(watt/kg) | ||||
| Pre-training | 7.60±1.35 | 7.51±1.05 | Time×Treatment | <0.001 |
| Post-training | 8.48±1.35 | 7.44±0.95 | Treatment | 0.137 |
| t value | −16.474*** | 1.313(NS) | Time effect | <0.001 |
| p value | <0.001 | 0.205 | ||
| % change | 11.6 (↑) | 0.9 (↓) | ||
| VJ (cm) | ||||
| Pre-training | 46.55±3.95 | 46.9±4.69 | Time×Treatment | <0.001 |
| Post-training | 51.75±3.85 | 47.0±4.09 | Treatment | 0.104 |
| t value | −27.386*** | −0.433(NS) | Time effect | <0.001 |
| p value | <0.001 | 0.670 | ||
| % change | 11.2 (↑) | 0.2 (∼) | ||
Values are mean±SD, *=p<0.05, **=p<0.01, ***=p<0.001, NS=not significant, HIIT=high-intensity interval training, Wpeak=relative anaerobic peak power output, VJ=vertical jump.
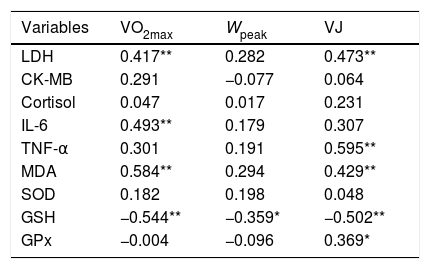
The correlation coefficient of muscle damage indices, inflammatory variables and oxidative stress markers with physical fitness variables has been presented in Table 6. VO2max showed significant (p<0.01) positive correlation with LDH, IL-6, MDA and significant negative correlation with GSH. VJ had significant (p<0.01) positive correlation with LDH, TNF-α, MDA, GPx (p<0.05) and significant negative correlation with GSH. Whereas Wpeak was found to be the less correlated variables among all physical fitness variables and only found to be negatively and significantly (p<0.05) correlated with GSH.
Pearson's product moment correlation coefficient of muscle damage indices, inflammatory markers, and oxidative stress markers with physical fitness variables in HIIT group players.
| Variables | VO2max | Wpeak | VJ |
|---|---|---|---|
| LDH | 0.417** | 0.282 | 0.473** |
| CK-MB | 0.291 | −0.077 | 0.064 |
| Cortisol | 0.047 | 0.017 | 0.231 |
| IL-6 | 0.493** | 0.179 | 0.307 |
| TNF-α | 0.301 | 0.191 | 0.595** |
| MDA | 0.584** | 0.294 | 0.429** |
| SOD | 0.182 | 0.198 | 0.048 |
| GSH | −0.544** | −0.359* | −0.502** |
| GPx | −0.004 | −0.096 | 0.369* |
Expressed values are correlation coefficient, *=p<0.05, **=p<0.01;Abbreviations: LDH=lactate dehydrogenase, CK-MB=creatine kinase (MB isoenzyme), IL-6=interleukin-6, TNF-α= tumor necrosis factor (alpha), MDA=malondialdehyde, SOD=superoxide dismutase, GSH=glutathione, GPx=glutathione peroxidase.
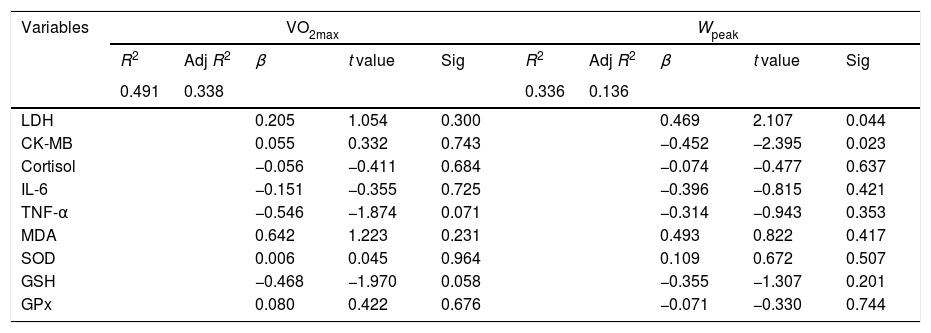
The regression equations for prediction of VO2max and Wpeak from LDH, CK-MB and cortisol have been presented in Table 7. First regression prediction model represents Durbin-Watson=1.692, Std. Residual=−1.765/1.686, F=3.217, Sig=0.008 (Dependent variable – VO2max; Predictors – GPx, CK, Cortisol, IL-6, Sod, GSH, LDH, TNF and MDA). Whereas the second model represents the Durbin-Watson=1.945, Std. Residual=−1.676/1.876, F=1.683, Sig=1.37 (Dependent variable – Wpeak; Predictors – GPx, CK, Cortisol, IL-6, Sod, GSH, LDH, TNF and MDA).
Prediction of regression coefficient based on the linear regression model of young male team-game players.
| Variables | VO2max | Wpeak | ||||||||
|---|---|---|---|---|---|---|---|---|---|---|
| R2 | Adj R2 | β | t value | Sig | R2 | Adj R2 | β | t value | Sig | |
| 0.491 | 0.338 | 0.336 | 0.136 | |||||||
| LDH | 0.205 | 1.054 | 0.300 | 0.469 | 2.107 | 0.044 | ||||
| CK-MB | 0.055 | 0.332 | 0.743 | −0.452 | −2.395 | 0.023 | ||||
| Cortisol | −0.056 | −0.411 | 0.684 | −0.074 | −0.477 | 0.637 | ||||
| IL-6 | −0.151 | −0.355 | 0.725 | −0.396 | −0.815 | 0.421 | ||||
| TNF-α | −0.546 | −1.874 | 0.071 | −0.314 | −0.943 | 0.353 | ||||
| MDA | 0.642 | 1.223 | 0.231 | 0.493 | 0.822 | 0.417 | ||||
| SOD | 0.006 | 0.045 | 0.964 | 0.109 | 0.672 | 0.507 | ||||
| GSH | −0.468 | −1.970 | 0.058 | −0.355 | −1.307 | 0.201 | ||||
| GPx | 0.080 | 0.422 | 0.676 | −0.071 | −0.330 | 0.744 | ||||
Abbreviations: Adj R2=adjusted R2, Sig=significance, Wpeak=relative anaerobic peak power, LDH=lactate dehydrogenase, CK-MB=creatine kinase (MB isoenzyme), IL-6=interleukin-6, TNF-α=tumor necrosis factor (alpha), MDA=malondialdehyde, SOD=superoxide dismutase, GSH=glutathione, GPx=glutathione peroxidase.
The main aim of the present study was to find the effect of HIIT induced alterations in muscle damage indices, inflammatory markers, antioxidant status and physical fitness variables of young team-game athletes. The present investigation revealed that 8 weeks HIIT can significantly (p<0.001) increase the muscle damage indices [LDH (15.0%), CK (14.4%)], cortisol (9.4%), inflammatory markers [IL-6 (15.7%), TNF-α (18.2%)]; antioxidant indicators [MDA (29.5%), GPx (0.4%)]; and physical fitness variables [VO2max (13.6%), Wpeak (11.6%), VJ (11.2%)] with significantly (p<0.001) decrease the BF% (7.6%) and plasma concentration of SOD (11.1%), GSH (10.8%) among young players.
The present HIIT intervention improved the body composition by significantly (p<0.001) reducing BF% (7.6%) and increasing BMI (1.1%). This observation agrees with Musa et al. (2009) where they reported 1.3% and 15.8% reduction in both body mass and BF% respectively after 8 weeks of HIIT (90% HRmax).25 High-intensity training generally hypothesized a reduction in body weight but instead of that, the present study depicted a significant increase in both weight and BMI which might due to the muscular hypertrophy.26 Previous finding suggested that HIIT increased the rate of fat oxidation due to increased catecholamine level which controls over the β-adrenergic receptors in adipose tissue and increased fatty acid-binding protein (FABPpm) content in skeletal muscle.27 On the other hand, the increase in the skeletal muscle fat oxidation likely resulted from several adaptations, including an increase in mitochondrial volume and altering several regulatory steps, e.g., adipose tissue lipolysis of TG to fatty acids (FA), transport of FA into the cell, intramuscular lipolysis of TG to FA and ultimately FA into the mitochondria.28–30
The LDH and CK are well known potential markers used for assessing both cardio-metabolic responses and the degree of skeletal muscle damage.4,5 Present study depicted a significant (p<0.001) rise in LDH (15.0%) and CK-MB (14.4%) which corroborates with Callegari et al. (2017) and Tesema et al. (2019), where CK and LDH both reported ∼100–200-fold increase after moderate/acute (60–70% HRmax for 45min) and high intensity/chronic (70–80% HRmax for 30min) training which gradually rises till 24h post-exercise.4,5 Wiewelhove et al. (2016) have reported that short intervals of sprint protocols under HIIT induce highest muscle damage and muscle soreness in comparison to the submaximal intensity of longer intervals.31 All these muscle damages may result due to the stretch-shortening cycle mechanism of muscle contraction during short duration high-intensity exercise.4,5 The development of stress-tension characteristics in skeletal muscle fibres leads to severe microdamage in the sarcolemma and finally cause the leakage of CK and LDH in bloodstream as a damage indicator.6 Increase in muscle damage markers may also result from the immunological and hormonal changes due to stress-tension association with high-intensity training.32 Interestingly muscle damage indices (i.e., LDH, CK)were only significantly increased against the short-period of exhaustive or HIE bouts and not against prolonged period workouts or low-intensity exercises.4,5
IL-6 and TNF-α are major markers to measure and limit pro-inflammatory cellular cascade to maintain homeostasis. They induce the inflammatory cascade following any HIE causing sympathetic stimulation.7 Present study depicted significant (p<0.001) increase in both IL-6 (15.7%) and TNF-α (18.2%) which corroborates with studies of Zebrowska et al. (2019) and Gerosa-Neto et al. (2016).8,9 Where Zebrowska et al. (2019) have reported that 3 weeks HIIT (5min 30W cycling) can elevate both the resting and maximum levels of IL-6 (approx. 46% and 50%) and TNF-α (approx. 47% and 15%) respectively.8 Gerosa-Neto et al. (2016) have reported 16 weeks HIIT (90% HRmax) induced a significant rise in TNF-α (104%).9 The HIIT induced temporary hypoxic conditions may cause to persuade an inflammatory response that increases IL-6 and TNF-α, mediated by leukocytes and manifested by elevated concentrations of proinflammatory cytokines.8,9 Contrarily, Brown et al. (2018) suggested that even after 48h of exercise the level of IL-6 and TNF-α were still higher than the resting condition.10 Collectively past studies have suggested that the post-exercise IL-6 increase in skeletal muscle may induce the onset of muscle soreness, reduced glycogen availability and alteration in calcium and stress hormone secretion and all those effects were much less in concentric contractions in comparison to eccentric exercises.8,10 However, a contradictory finding reported that TNF-α returned to baseline level faster than other cytokines like IL-6.33
Previously acute HIE of both short-term and long-term exercise was reported to create a redox imbalance and an increase in oxidative stress markers (i.e., SOD, catalase, sulfhydryl group).11–13 In the present study, HIIT induced a significant increase in MDA (29.5%, p<0.001), GPx (0.5%, p<0.05) and a significant decrease in SOD (11.1%, p<0.001), GSH (10.8%, p<0.001) were corroborated with studies of Miyazaki et al. (2001), Bogdanis et al. (2013) and Ugras (2013).13,16,34 Bogdanis et al. (2013) has reported 3 weeks HIIT (high-intensity cycling) induced a significant increase in oxidative stress markers i.e., protein carbonyl (PC), TBARS, GPx, catalase, total antioxidant capacity (TAC) and even reported to last for 24–48h after exercise.16 Similarly, Miyazaki et al. (2001) and Ugras (2013) have reported a significant increase only in MDA (approx. 40%), a marker for lipid peroxidation against longitudinal HIIT period.13,34 Although Azizbeigi et al. (2014) has reported training induced significant increase only against SOD and GPx but not in the MDA level.35 Excessive HIE or overtraining leads to a temporary hypoxic condition which confers the overproduction of ROS, creates oxidative stress and challenges redox equilibrium which further disrupts the cellular homeostasis and confers the disturbance in scavenging property of antioxidant enzymes to lead the rise in lipid peroxidation.13,36 Several studies have reported that even a single bout of intense exercise can alter the antioxidant equilibrium and increase MDA level.34,37 Antioxidant adaptations in the present study may be due to HIIT induced excess ROS generation within mitochondria which diffuse into the cytoplasm and activate AMP-activated protein kinase (AMPK) that transcriptionally co-activates the PGC-1 α and mitochondrial biogenesis via activating Peroxisome Proliferator Activated Receptor-gamma (PPARγ) and PPARγ Coactivator-1α (PGC-1 α).38 Alternatively, ROS may act as a key mediator for exercise-induced cytokine response through the stimulation of inflammation regulating NF-κB and data proved the possible interaction between increased lipid peroxidation and cytokine secretion.10 Although there are studies like Rahnama et al. (2007) and Vezzoli et al. (2014) where slight or no significant changes was observed against high-intensity physical training-induced oxidative stress marker variables.39,40 Additionally, Sousa et al. (2016) has reported by summarizing 38 studies that pro-oxidants i.e., TBARS/MDA, PC, myeloperoxidase, H2O2 etc tended to decrease significantly in association with an increase in SOD, GPx, catalase, TAC and GSH as a physical training-induced effect.15
The present study depicted significant (p<0.001) rise in VO2max (13.6%) and Wpeak (11.6%)which corroborates with studies of Fereshtian et al. (2017), Macpherson et al. (2011) and Zychowska et al. (2017) with increase in7.6%, 11.5% of VO2max and 2–4% (approx.) change in anaerobic power output respectively.41–43 The significant increase in VO2peak was mainly attributed to the higher mitochondrial enzyme activities i.e., citrate synthase (CS); cytochrome-c oxidase (COX); COX-II, IV protein content; and β-hydroxyacyl-CoA dehydrogenase (β-HAD).2,28,45 Other studies hypothesized that improvement in stroke volume and maximal cardiac output (Qmax) following HIIT were 15–35% responsible for the improvement in VO2max.2,42 Considerably, the improved Wpeak correspond to an improved anaerobic capacity index which might have happened due to the improved lactate tolerance, developed sprinting ability within the anaerobic zone with higher glycolytic activity level.17,43 It has been reported that HIIT increased glycolytic enzymatic activities (e.g., hexokinase, glycogen phosphorylase, phosphofructokinase), muscle buffering capacity and ionic adaptations including increased Na+-K+-ATPase content to compensate the enlarged energy demand during an anaerobic HIIT.45,46 Alternatively, HIIT induced improvement in anaerobic capacity may due to the adaptations in skeletal muscles (reduced phosphocreatine degradation, enhanced glycogen content) along with increased type IIA ratio and reduced IIB ratio.44,45 Present studied increase in VJ (11.2%) corroborates with Ferrete et al. (2014), where similar high-intensity training induced significant increase (∼6.7%) in jumping capacity has been reported which further suggests the possible transfer from the gain in the leg muscular power into the sprint performance.47 Intense training-induced enhancement in jumping capacity may due to the improved muscular hypertrophy and neuro-muscular coordination.47
In the present study, two separate linear regression models were computed for predicting VO2max and Wpeak where the selected predictors were GPx, CK-MB, Cortisol, IL-6, SOD, GSH, LDH, TNF-α and MDA. Out of all these predictor variables, only LDH (p=0.044) and CK-MB (p=0.023) were found to be the principal predicting variables for Wpeak but the regression model itself was insignificant (F=1.683, Sig=1.37). On the other hand, the regression model significantly predicted VO2max (F=3.217, Sig=0.008) but there was no such variable which can alone significantly predict VO2max. However, Pearson's product-moment correlation identified GSH as one such variable which had significant negative (p<0.01) correlation with VO2max and VJ. VO2max showed a significant positive correlation with LDH, IL-6, MDA and VJ showed significant positive correlation with LDH, TNF-α, MDA, GPx. It may be hypothesized that VO2max and VJ were the most important dependent variables on LDH, IL-6, TNF-α, MDA, GSH and GPx.
It is the limitation of the present study that it was unable to predict the gender variation on the studied parameters as it did not include female participants. Another shortcoming of the is that it only focused on a particular type of sprint HIIT (2min intense sprinting at 90–95% of HRmax, work: rest=1:1) although plenty of training variations are there in terms of training intensities. Therefore, the study is unable to suggest the intensity wise effects of HIIT on the studied parameters.
ConclusionThe present sprint HIIT protocol was found to induce an overall significant rise in oxidative stress level (MDA, GPx, SOD, GSH); inflammatory variables (IL-6, TNF-α); and muscle damage profile (LDH, CK-MB, cortisol) with concomitant improvements in fitness variables (VO2max, Wpeak, VJ). The study concludes that the inflammatory and oxidative stress condition may finally lead to muscle damage, which all may occur due to the development of temporary hypoxic condition resulting from intense/exhaustive workout intervened with insufficient intervals which will contrarily induce the overtraining effect. Correlation and regression study predicts that muscle damage, inflammatory and antioxidant variables can be used to measure and predict the limitation of muscular strengths, endurance capacity and anaerobic power. Although more significant prediction can be done against the endurance capacity in comparison to anaerobic power. However, muscle damage indices (LDH and CK) are the best factors to predict anaerobic power than others. The improved fitness variables surely revealed the effectiveness of HIIT to optimize performance specially in pre-competitive phase. But for long-term use, this HIIT protocol is not recommended in general as it develops ROS generation, alters redox equilibrium and influences variation in enzyme levels, inflammatory markers which simultaneously leads to an oxidative stress condition, inflammation and muscle damage and that may cause muscle soreness causing a burden on athlete's health. Although HIIT must be done under the supervision of scientific experts/trained coaches who can modify or modulate training regimen as per the athlete's individual physical and physiological capacity and response to the training. The association of HIIT with some antioxidant (vitamins, natural products etc.) supplements must be studied in future to reveal whether HIIT induced adverse health effects can be prevented or not.
FundingThis research received no specific grant from any funding agency in the public, commercial, or not-for-profit sectors.
Conflict of interestAll authors have agreed to publish the present article and declare no conflict of interest.
Authors are grateful to all players for their voluntary and valuable participation. Authors are also grateful to Rammohan College, Kolkata, and Sports Authority of India, NSEC, Kolkata for their all kind support for completion of the study.

